Football Player Rating & Role Clustering: Why We Built It This Way
How Futrix Metrics builds player ratings and role clustering: feature dimensions, Base+Pro architecture, validation logic, and practical scouting use cases.
Why We Built This Architecture
This post covers the core features and model design thinking behind the Futrix Metrics Player Rating & Clustering system. If you want to start using the data directly, see our API documentation or subscription plans.
What Problem Does This Solve
The most common questions in football data analysis are: How did a player actually perform this season? What role do they fit? And how do you find a player with a similar profile without relying on gut feeling?
Traditional rating approaches — media scores or simple goals + assists tallies — share a fundamental weakness: they’re either too subjective, or they only capture the attacking end of the game while ignoring defensive contribution, aerial duels, foul management, and every other dimension that determines a player’s real value. Many media ratings also apply a single universal scale across all positions, making it nearly impossible to distinguish how a centre-back performed as a centre-back versus how a striker performed as a striker.
The Futrix Metrics rating system was built from the ground up on a model-driven principle: every player should be evaluated objectively within the context of their own role and position. The role clustering module then adds a layer on top — identifying tactical archetypes so that finding similar players becomes a data operation, not a subjective judgement call.
Core Features
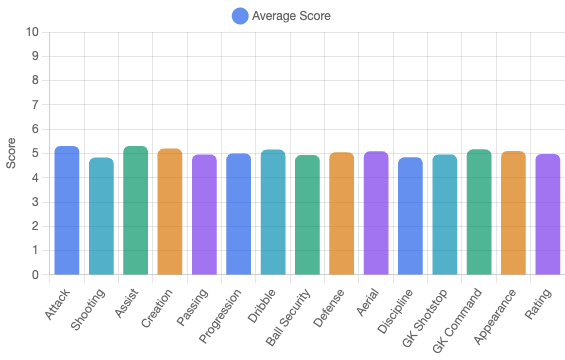
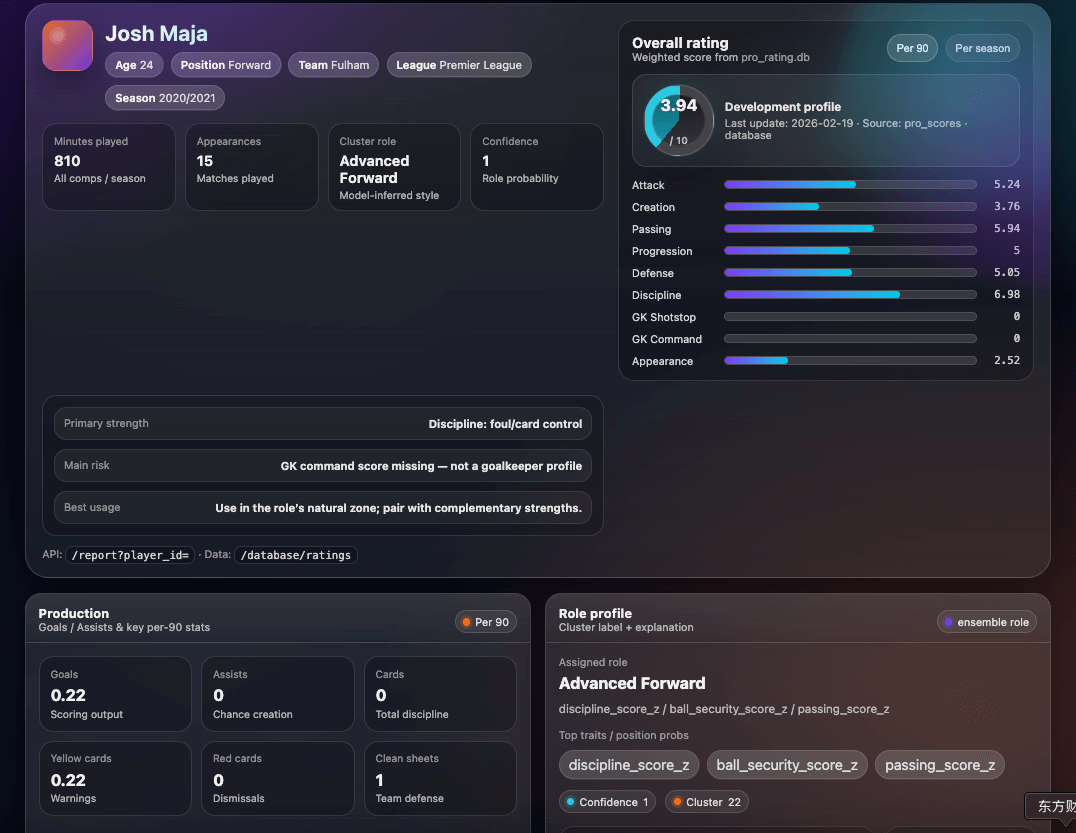
1. Player Rating
The rating system outputs scores across multiple skill dimensions and combines them into a single composite rating. Each component is only applied to positions where it is relevant.
| Dimension | Description |
|---|---|
attack_score | Shot quality and goal-scoring efficiency |
assist_score | Passing contribution and assist creation |
shooting_quality_score | Quality of shot attempts, independent of outcome |
creation_score | Chance creation and key pass volume |
progression_score | Forward ball-carrying and progressive passing |
dribble_score | Dribble success rate and ability to beat opponents |
ball_security_score | Ball retention, dispossession rate, and composure under pressure |
tackle_score | Tackling and interception ability |
defense_score | Overall defensive contribution including clearances and blocks |
aerial_score | Aerial duel win rate and heading effectiveness |
conceded_score | Defensive pressure on goals conceded |
foul_card_score | Foul discipline and card management |
goalkeeper_score | Composite goalkeeper performance |
gk_shotstop_score | Shot-stopping quality — saves made relative to xG faced |
gk_command_score | Goalkeeper’s control of the penalty area, including sweeping and distribution |
appearance_score | Minutes played and availability across the season |
The system supports longitudinal comparison across seasons and leagues. You can track a player’s rating trend through Premier League, La Liga, Bundesliga, and Serie A seasons side by side, or compare players across clubs within the same competition.
Via the API /database/ratings endpoint, you can filter results by league, season, and club, and generate ready-to-present HTML scouting reports. Register for an API key at futrixmetrics.com/checkout?plan=basic.
2. Role Clustering
The core question the clustering module answers is: What tactical type is this player?
Using unsupervised clustering algorithms (GMM-based), the system groups players into tactical archetypes — for example: ball-carrying midfielder, defensive wide back, target forward, deep-lying playmaker. From there you can:
- Search by player name, season, club, or position
- Reverse-search using
cluster_idorcluster_nameto find players in the same group - Analyse a squad’s role distribution to identify structural imbalances or positional overlap
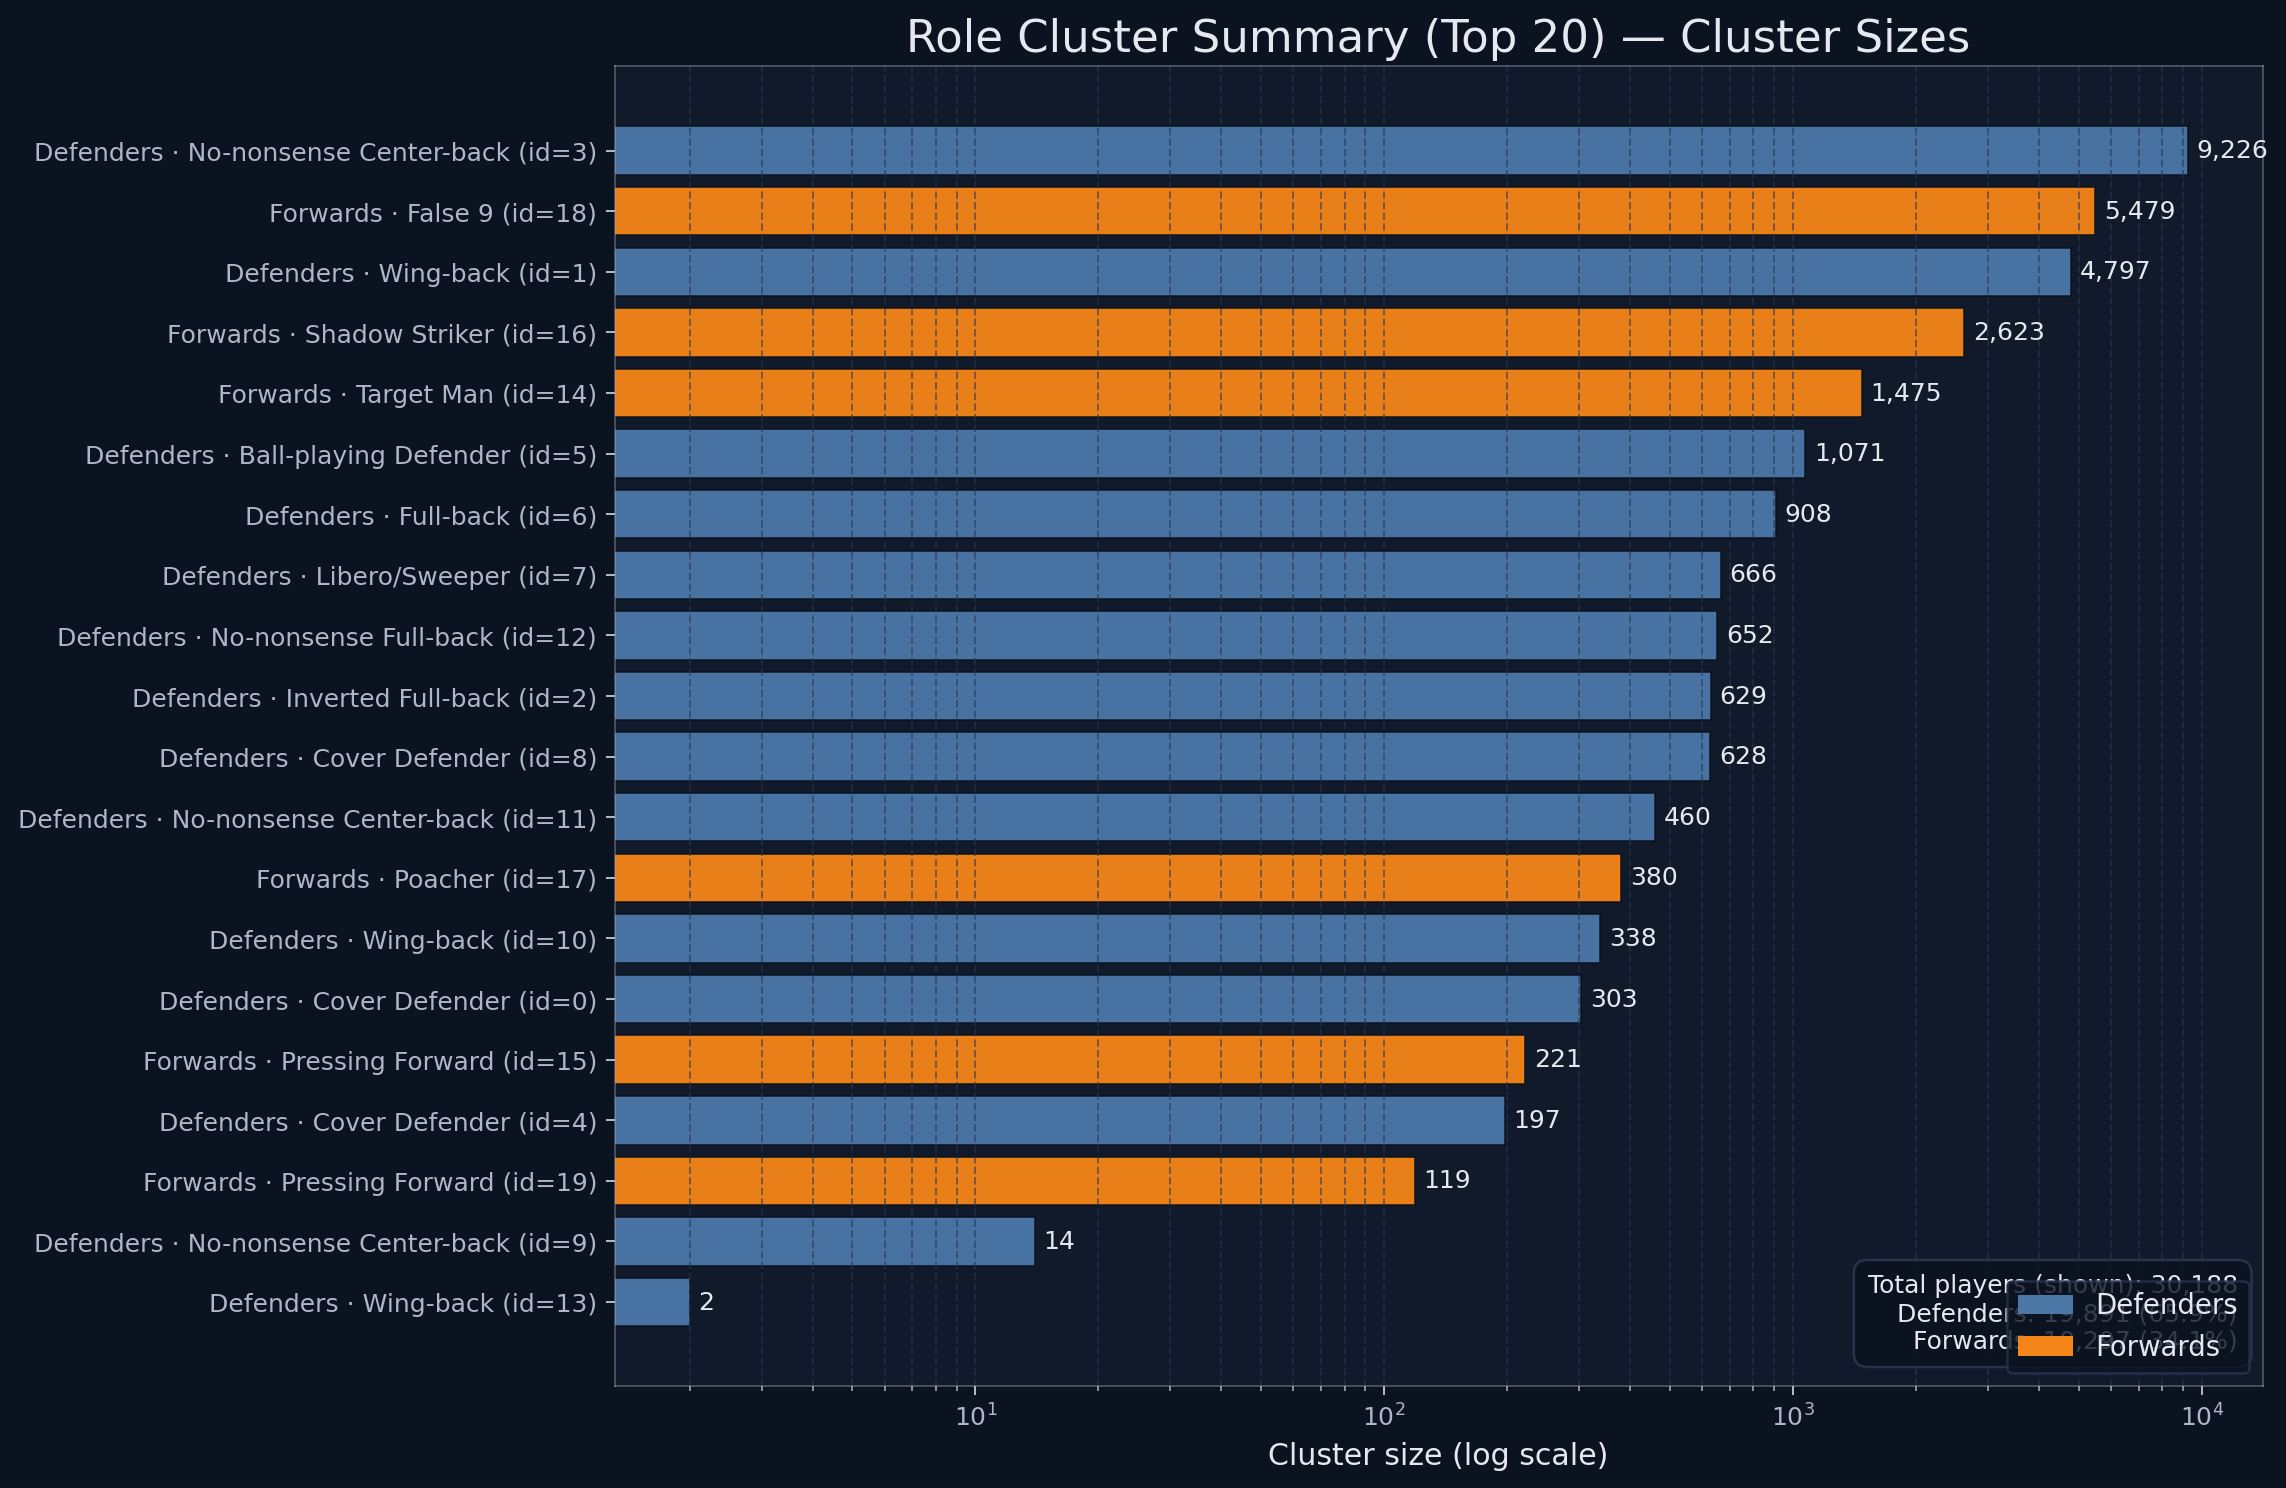
The practical value for scouting is direct: when you need a replacement for a specific position, instead of relying on reputation or highlight reels, you query the cluster that player belongs to and get a ranked list of similar profiles — spanning multiple leagues and seasons.
Further reading: Opta’s event data definitions · FBref multi-league statistics
Model Design: Why This Architecture
Why Not a Single Model?
The first instinct is always: train one model, feed in all the stats, get one score. That approach breaks down for several reasons.
1. A striker’s goal and a goalkeeper’s save should not be scored by the same logic.
The value of an attacker comes from shot conversion and threat creation; a goalkeeper’s value comes from stopping those shots; a centre-back’s value comes from clearances and aerial wins. Collapsing all of this into a single model causes averaging distortion — every position gets pulled towards an undefined middle ground that doesn’t accurately represent anyone.
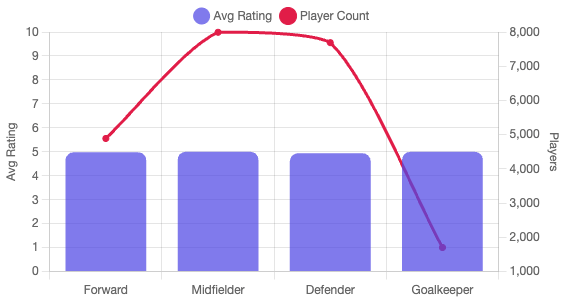
Our approach is to define a separate target variable for each skill dimension (attack, passing, defending, aerial, goalkeeping), then apply position-based rules (GK / DEF / MID / FWD) to determine which components feed into each player’s final composite score.
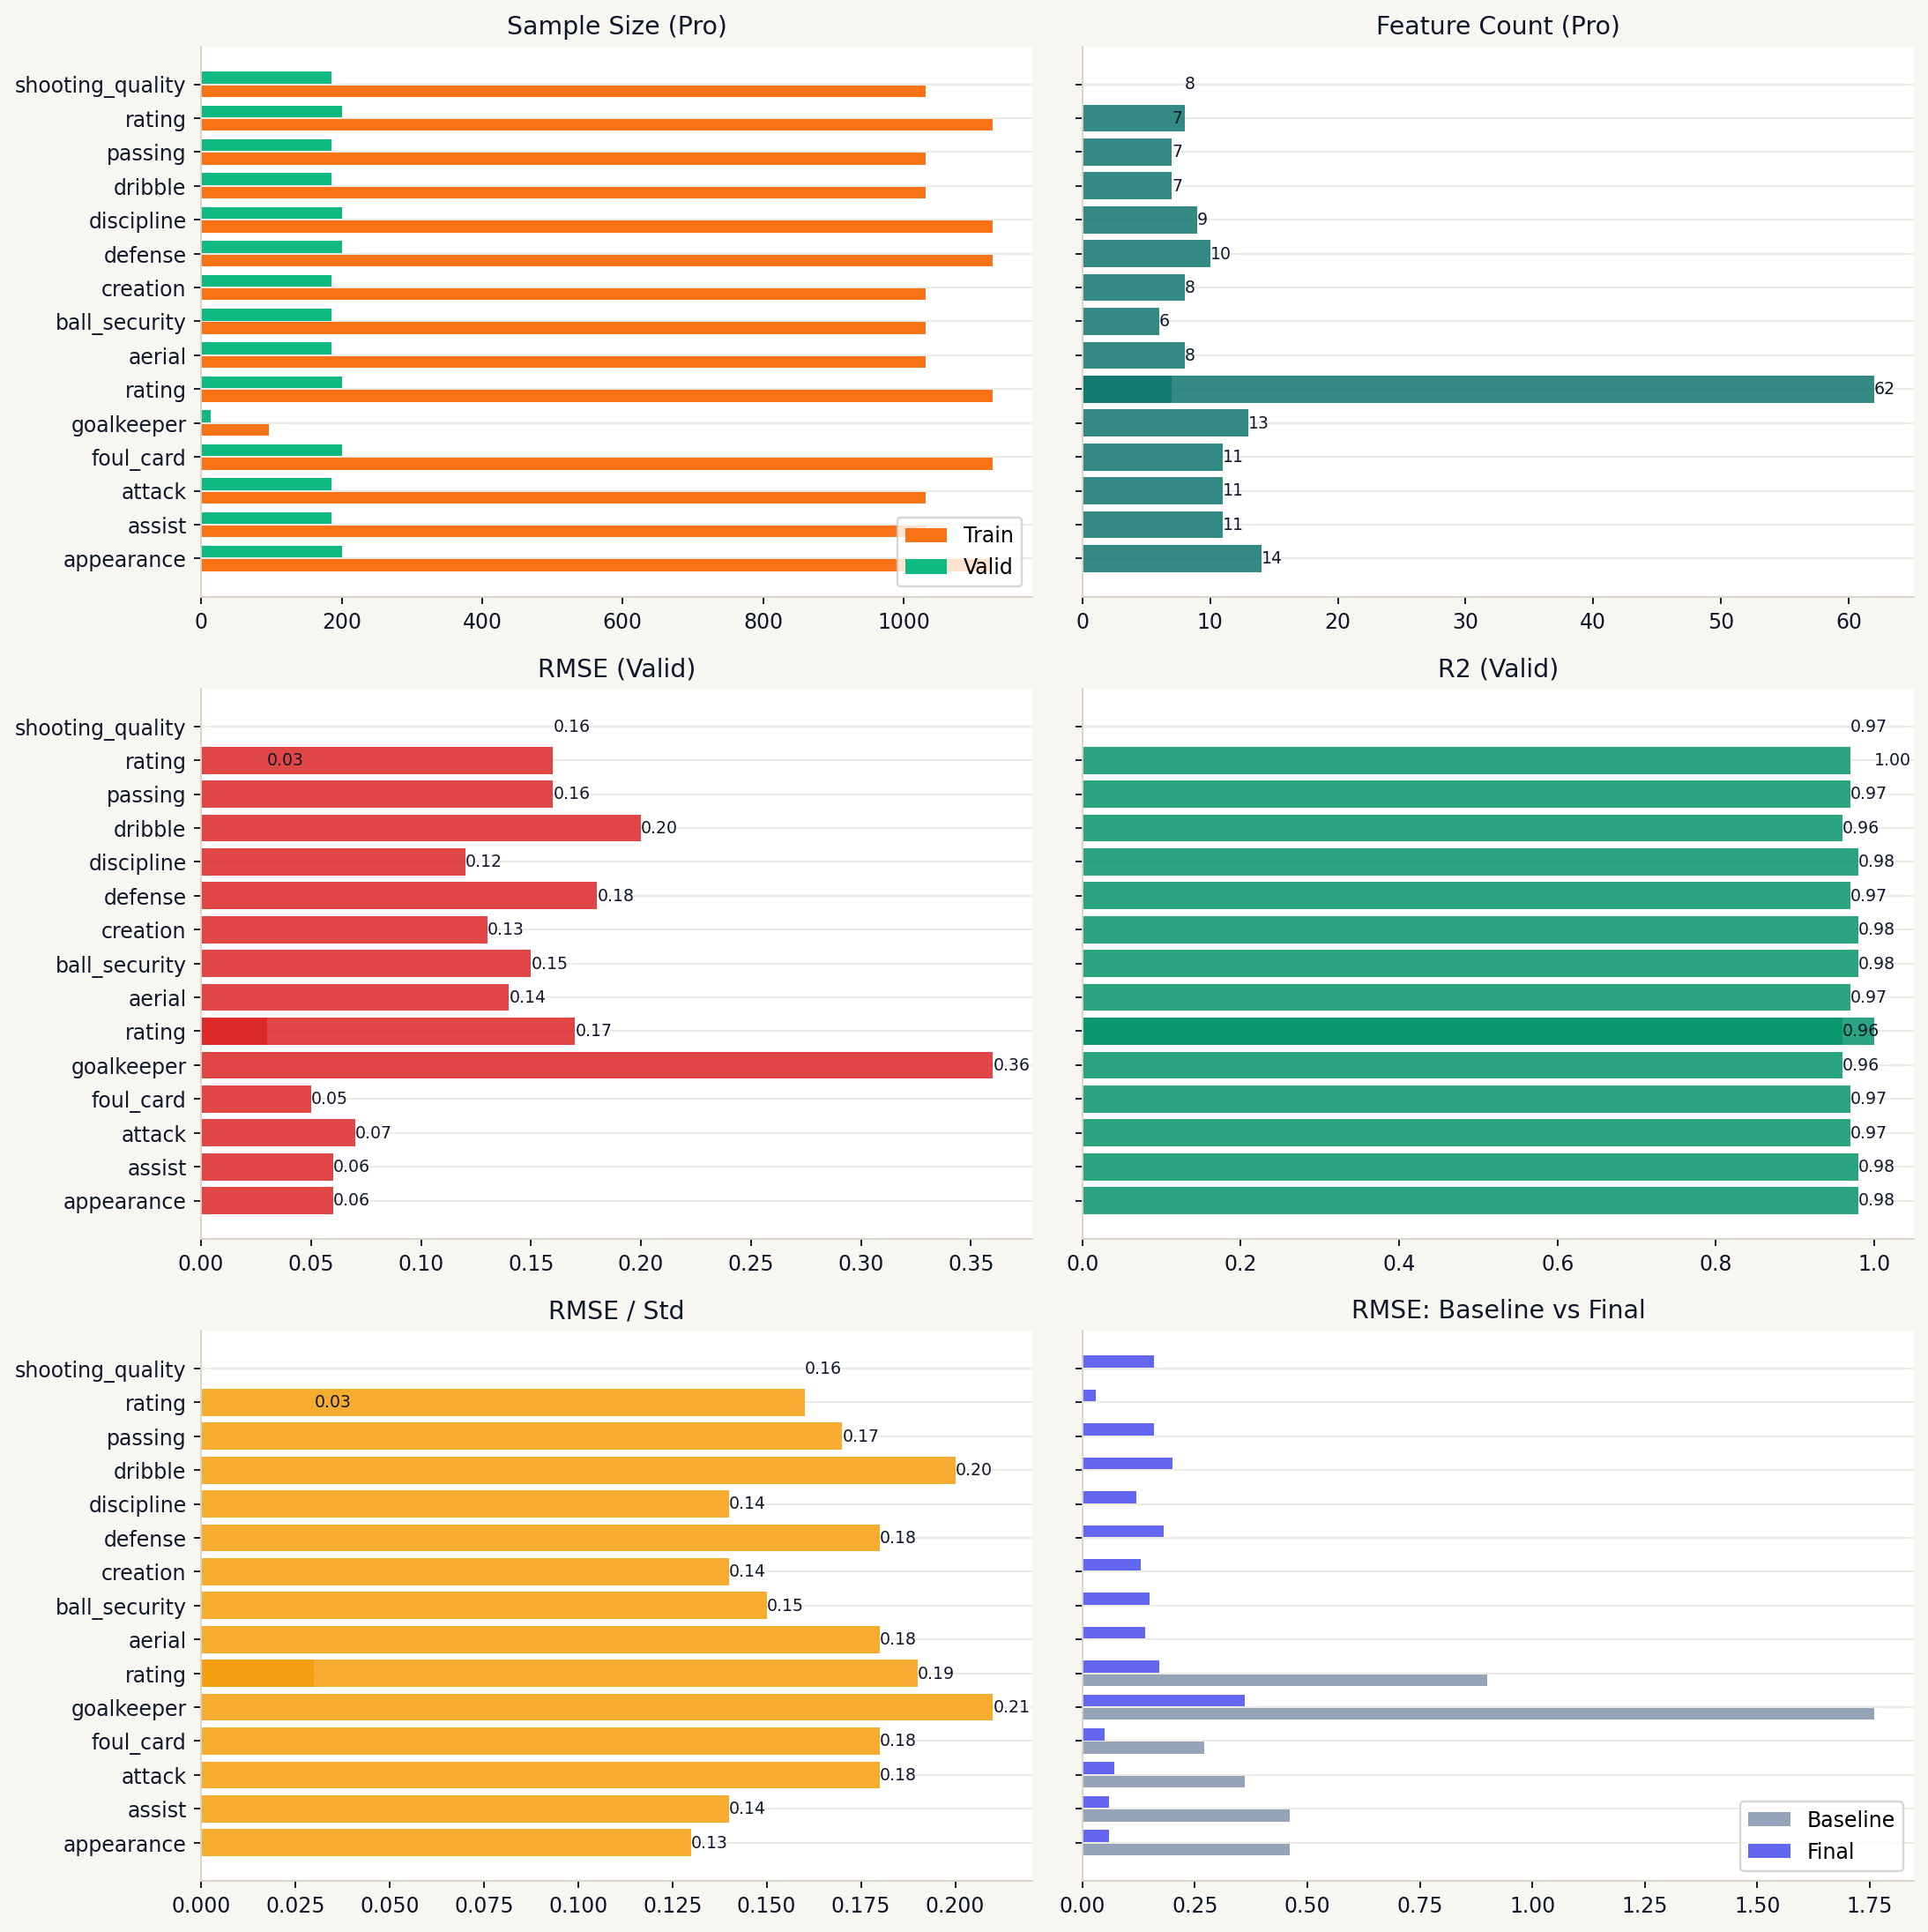
2. Validation performance matters more than training performance.
This is a counterintuitive but important engineering decision. Most of our model dimensions achieve R² scores above 0.96 — but we consistently optimise for validation set error, not training fit. An overfitted rating model will produce badly distorted scores on real-world data, which in a scouting context means bad decisions. We prioritise generalisation even when it means accepting a slightly lower training metric.
Base + Pro Dual-Layer Architecture
The system is split into two layers:
Base Model: Uses approximately 17 core statistical features (goals, assists, pass completion rate, aerial duels, etc.) — the fields that most public data sources can provide. Suitable for leagues where granular tracking data is unavailable, or for analysing older seasons with limited data.
Pro Model (Delta Architecture): The Pro model is not a separate scoring system — it’s an incremental correction layer (delta) applied on top of the Base score. When richer input fields are available (such as xG, pressures per 90, progressive carries, or shot-stopping metrics), the Pro model calculates the adjustment those additional signals warrant and adds it to the Base result.
Final Score = Base Prediction + Pro Delta CorrectionThe benefits of this design:
- Both layers share the same scoring scale — no inconsistency between Base and Pro outputs
- Richer input data produces more precise scores, rather than forcing an either/or choice between models
- Iterating the Pro layer doesn’t require retraining the Base from scratch
This is philosophically similar to Opta’s tiered data approach: more detailed input data should produce more detailed — not just different — outputs.
Confidence Management
Every rating result carries a confidence indicator, driven by three factors:
- Playing time: confidence is scaled down when a player has insufficient sample size
- Missing fields: if Pro-layer inputs are absent, the output holds Base-level confidence rather than inflating it
- Distribution outliers: when input statistics fall outside the model’s training distribution, a low-confidence flag is attached
This means you can distinguish between a high-confidence 7.8 and an uncertain 7.8 — which matters when the decision downstream is a transfer or contract.
What You Can Do With It
Scouting & Recruitment: Filter players in the Premier League, Bundesliga, Serie A, La Liga, and other major leagues by role archetype, then get a shortlist ranked by rating — with each player’s breakdown by dimension.
Squad Structure Analysis: Use clustering results to identify positional overlap or gaps in a squad’s role distribution before a transfer window.
Player Development Tracking: Compare a player’s per-dimension scores across multiple seasons to quantify genuine progress or decline — not just goals and assists.
Data Product Integration: Pull rating data into your own analytics platform or dashboard via the API, without manually processing raw match statistics.
Further Reading & Sources
- Futrix Metrics — Player Rating & Clustering Project
- Model Development Background & Technical Notes
- Full API Documentation
- Premier League Official Site
- Opta Event Data Definitions
- FBref Multi-League Player Statistics
Want API access or have questions? Visit www.futrixmetrics.com/services to explore plans.