
Action records aligned to tracking footage, frame by frame.
Project in progress · Tracking Data
Dynamic running analysis for decision intelligence
A tracking-data project that moves beyond box scores — connecting event data, tracking frames, route prototypes, decision regret, state windows, role fit, and error mining into player-level decision profiles.
97k+Tracking frame rows
4,223Indexed events
13k+LTCE candidates
M1–M7Decision pipeline
Data Foundation
From tracking clips to explainable decision review
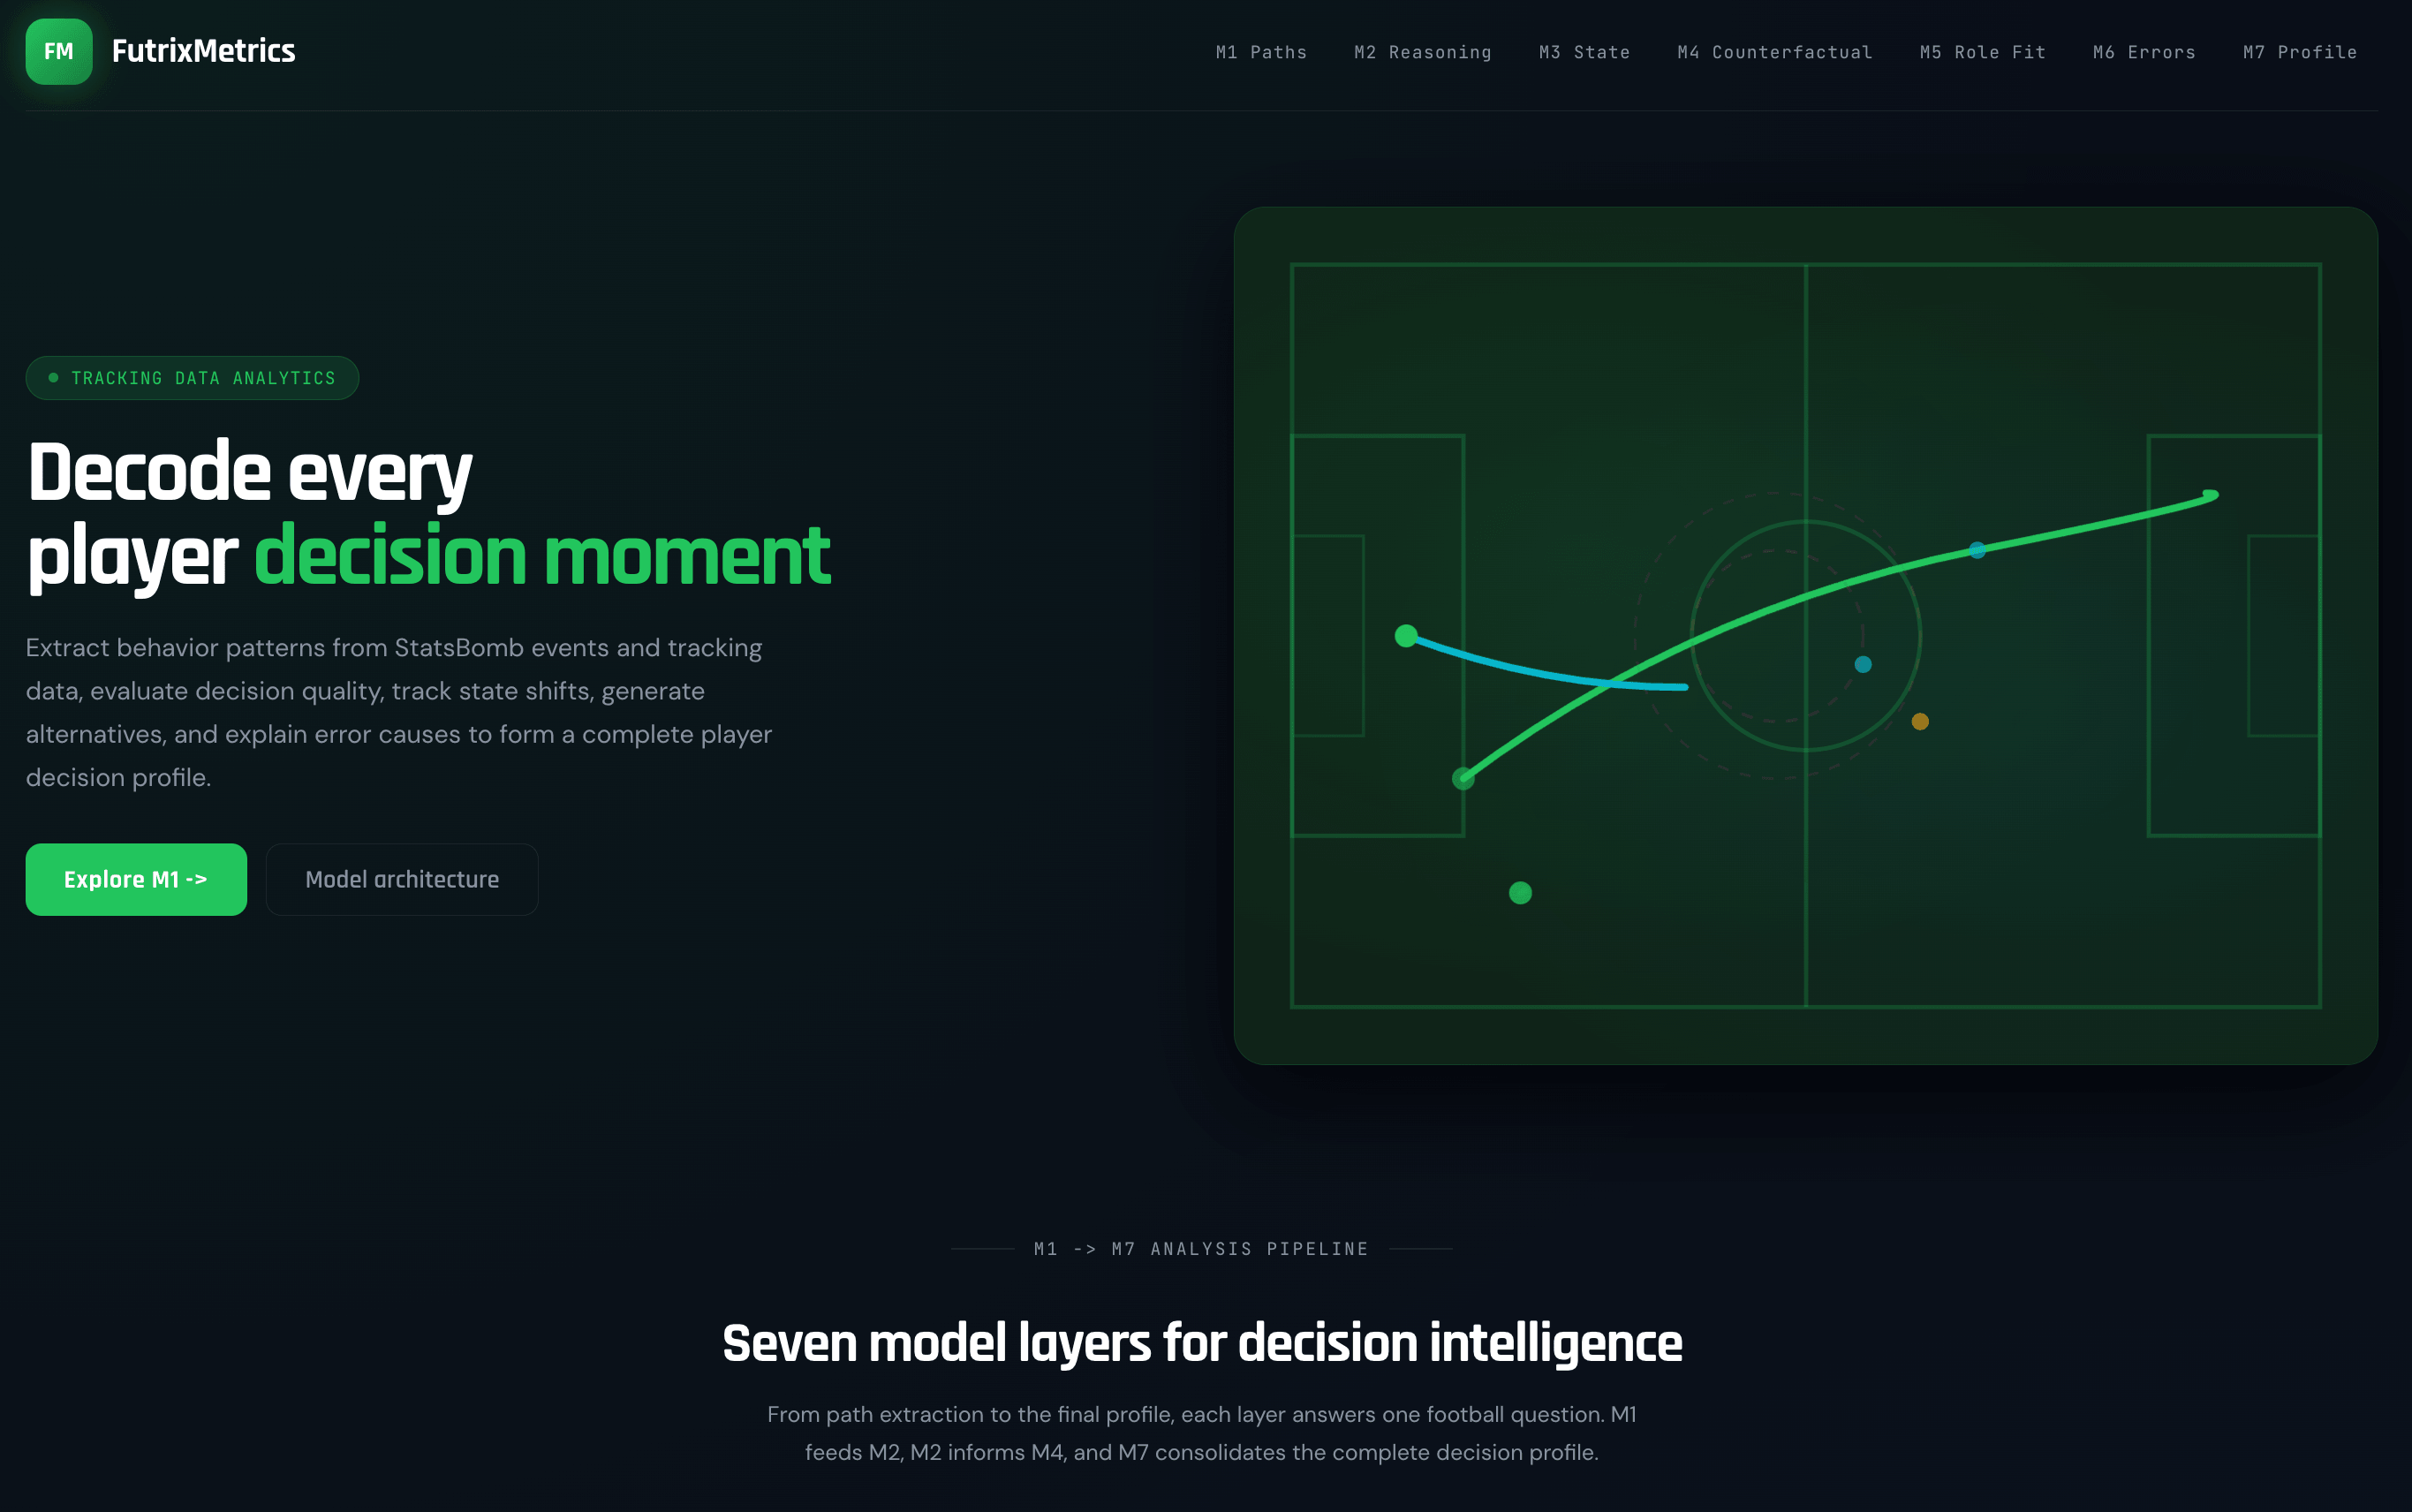
Local movement, ball state, pressure, passing lanes, and outcomes become frame-by-frame decision intelligence — aligning action records with tracking footage, teammates, opponents, and route labels.
Ball control state, locations, and pressure indicators per moment.
Nearby teammates and opponents give spatial context, not isolated events.
Labeled routes and player summaries feed the M1–M7 pipeline.
M1 → M7 Pipeline
Seven layers, from path behavior to player profile
Each layer answers one football question and feeds the next — M1 feeds M2, M2 informs M4, and M7 consolidates the complete decision profile.
Path Prototype Extraction
Clusters pass, carry, and shot paths into route labels, then builds player-level top routes and style fingerprints.
Decision Reasonableness
Scores real actions against learned alternatives and separates reasonable, suboptimal, and poor decisions.
In-Match State Windows
Segments performance into five-minute windows to identify hot, stable, stressed, and fatigue-drop phases.
Counterfactual Choice
Generates candidate alternatives and compares expected gain against the action that actually happened.
Role Fit Embedding
Learns behavior embeddings and compares players with role centroids to support position-fit discussions.
Error Pattern Mining
Classifies failures into pressure, vision, decision, and technical error families for training priority.
Decision Profile
Combines M1–M6 into player-level decision profiles, peer similarity, and recruitment-ready summaries.
M1 · Path Extraction
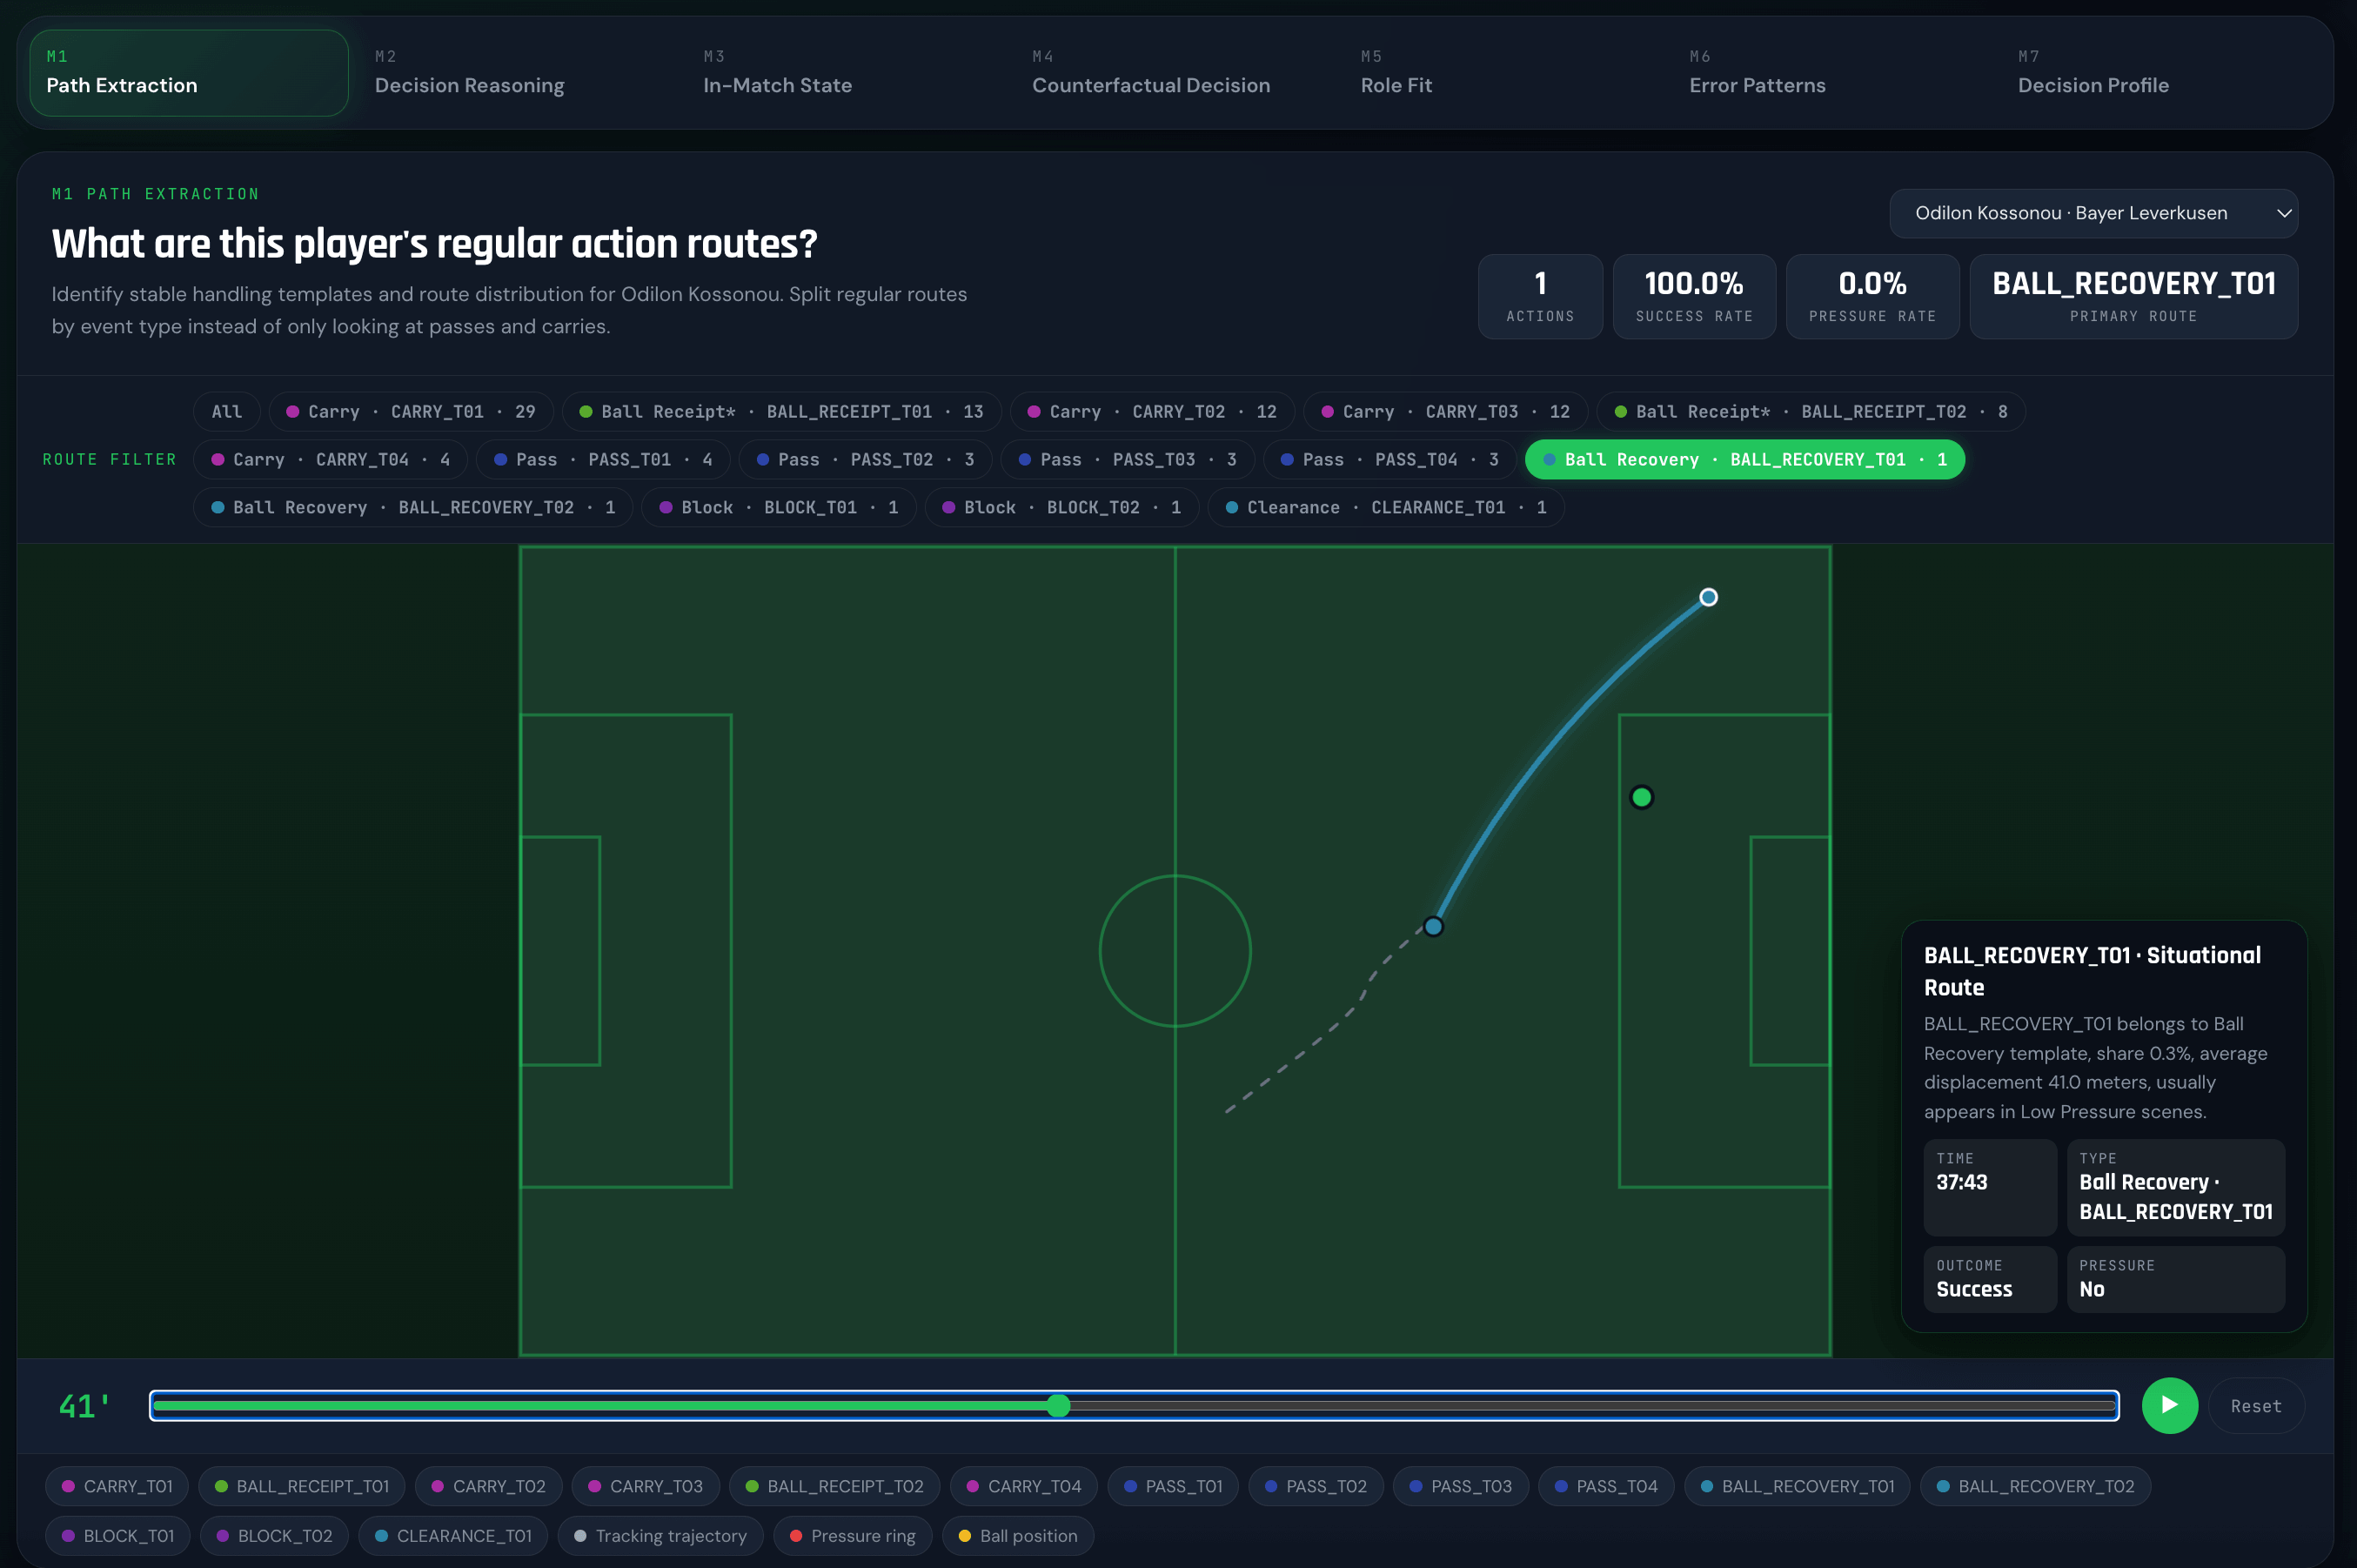
Regular action routes, not just passes
M1 clusters pass, carry, and shot paths into route labels, then builds each player's top routes and style fingerprint — so you see stable handling templates and route distribution split by event type, not only passes and carries.
Route labels Style fingerprint Top routes
LTCE Direction
The next layer is local tracking counterfactual analysis
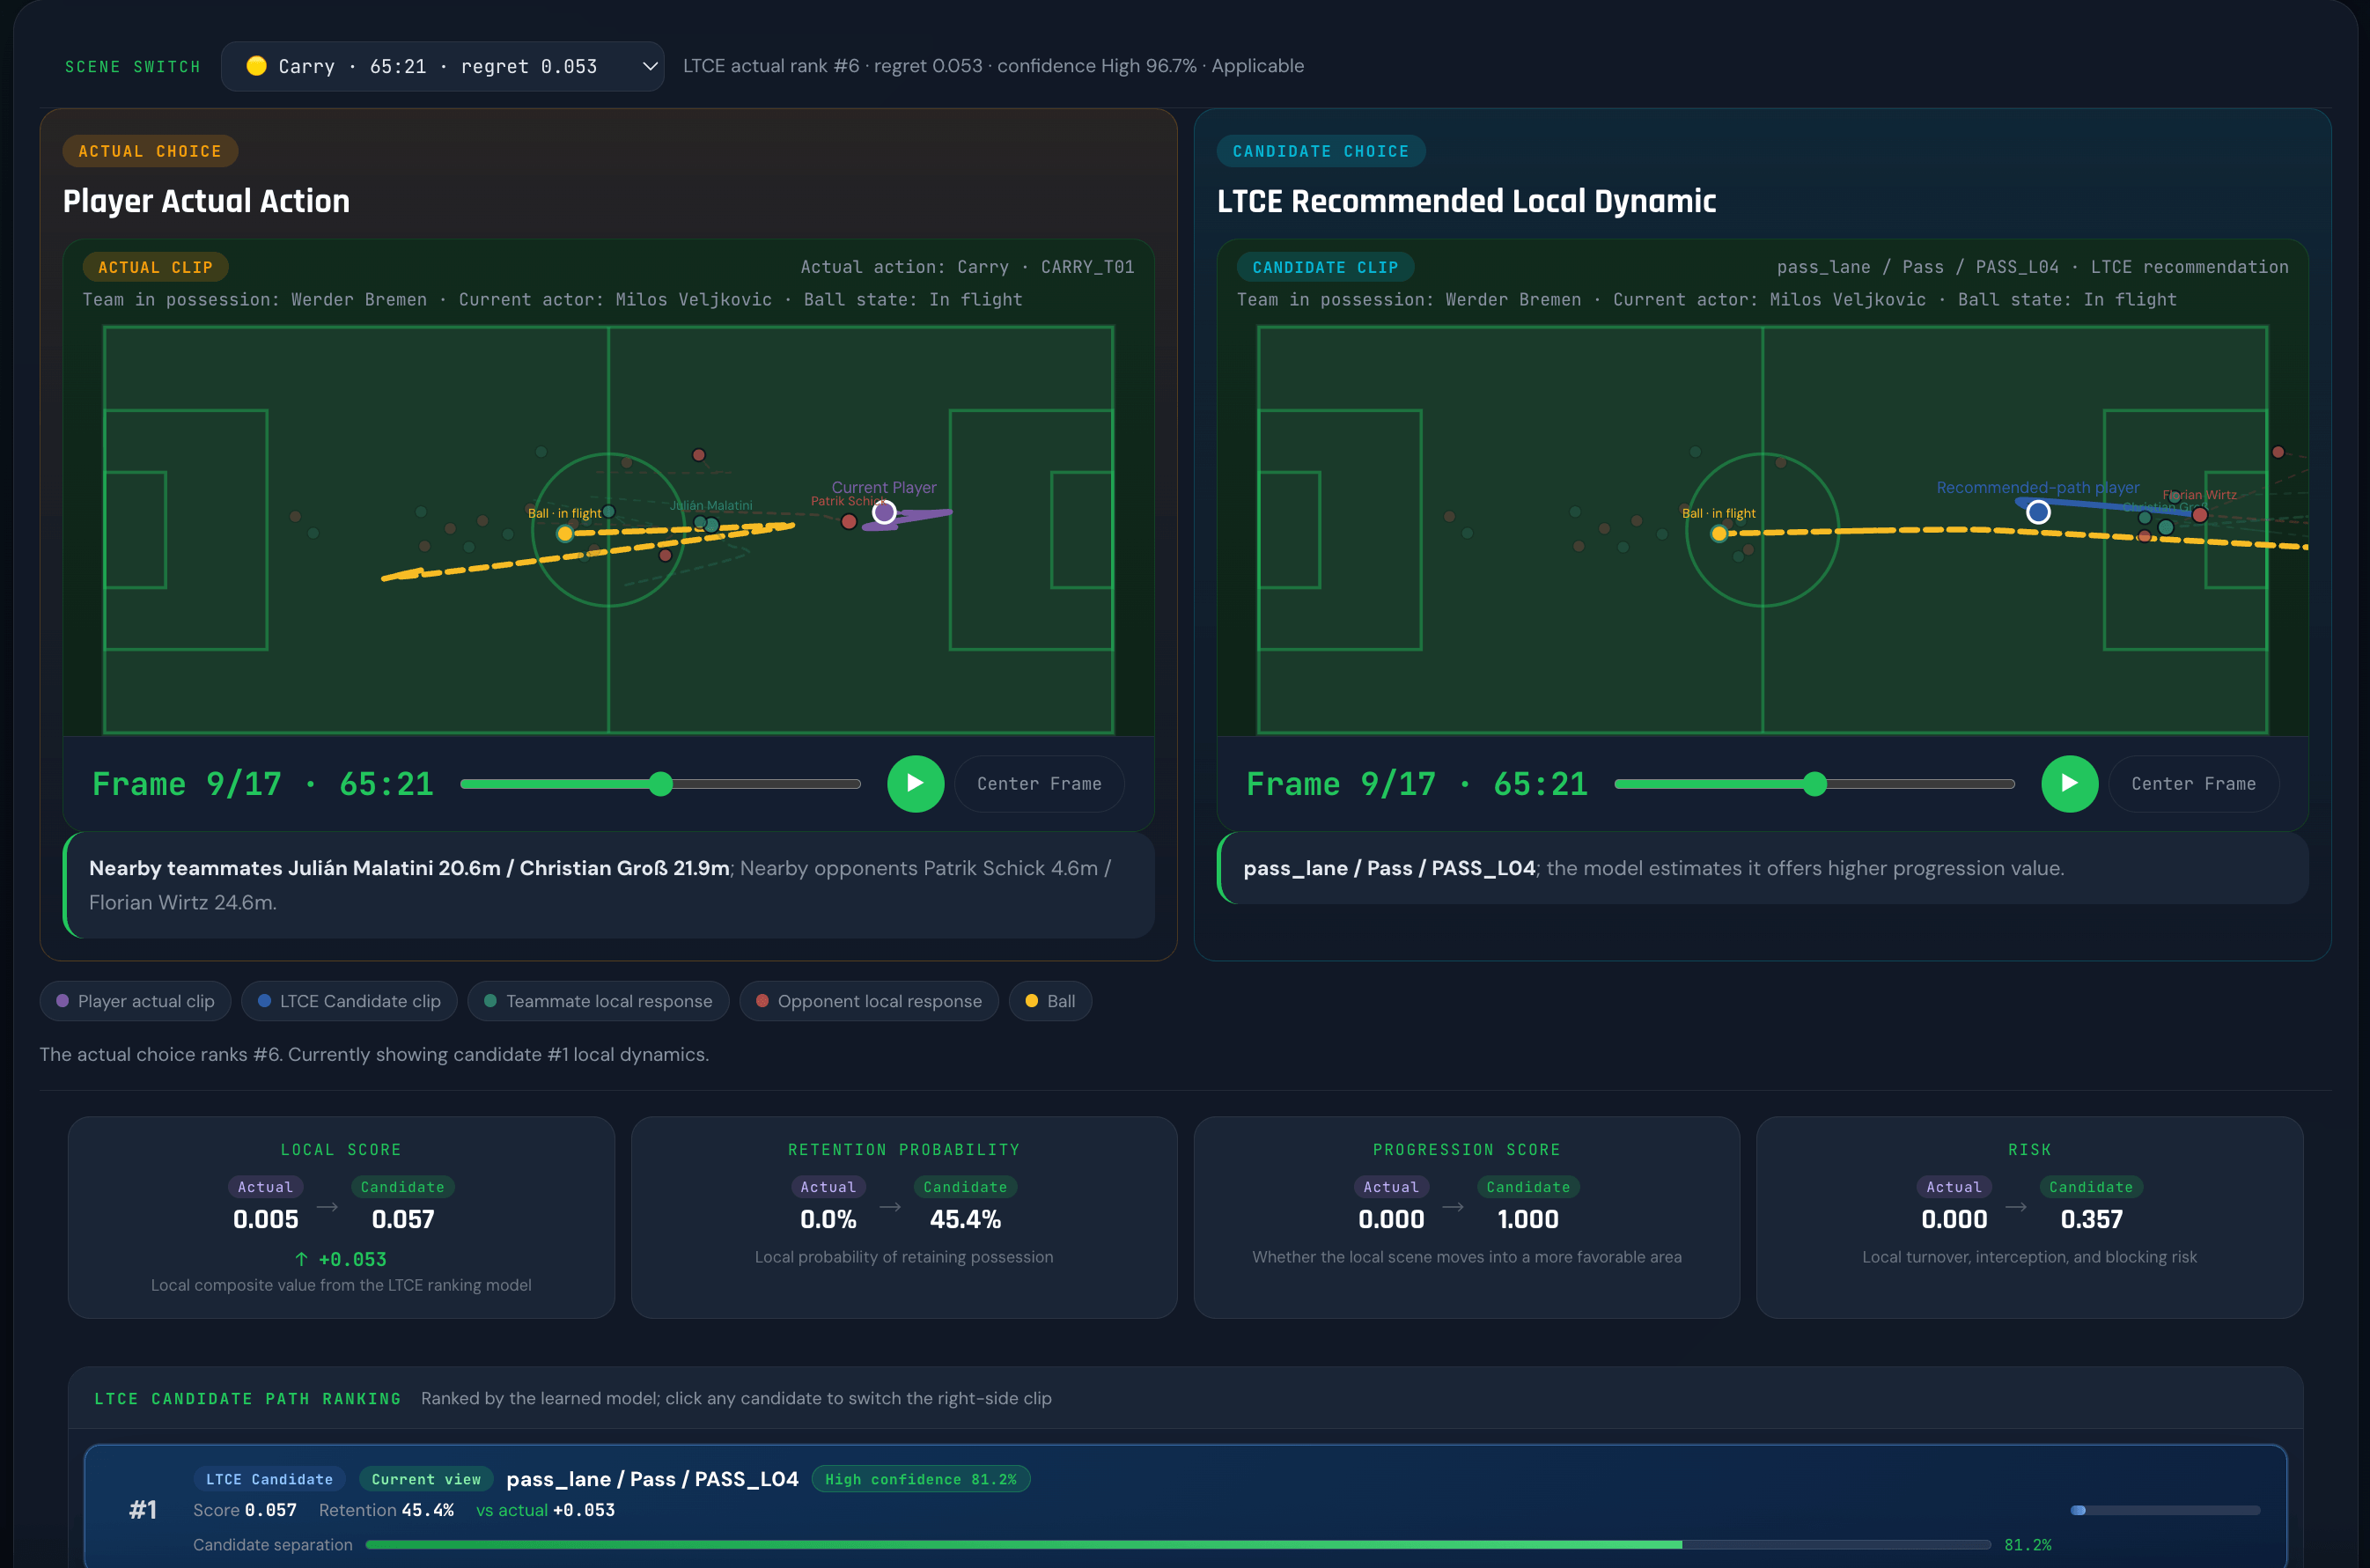
LTCE upgrades M2 and M4 from event-template alternatives toward tracking-native local counterfactuals: which lanes were actually reachable, how nearby players could respond, and why one option ranks higher than another.
M4 · Counterfactual
Compare the actual choice with better alternatives
M4 generates candidate alternatives and weighs expected gain against what actually happened. The data supports two-dimensional local tracking, pressure, and route labels — so the page describes LTCE as a practical local-window model, not a full 22-player simulator.
- Candidate lane generation
Carry, pass, pressure-escape, and contest-risk lanes recalled from local tracking context.
- Local multi-agent response
Ball, carrier, nearby teammates, and opponents over a short 1.5–2.5 second window.
- Learning-based ranking
Retention, progression, pressure relief, creation, risk, and shape-cost signals.
✦ Project in progress · tracking data
Request the tracking demo or discuss a use case
Get deeper details, demo access, or data collaboration — from frame-by-frame decision review to a commercial partnership built on the LTCE pipeline.