Football Decision Intelligence: Understanding Player Decisions Through Data
Demo of football decision intelligence analyzing player actions, tactical routes, decision gaps, and pressure impact using simulated match data.
Overview
Modern football rating systems often present a single overall score as the final answer—a player gets 7.4 or 78 points with no explanation of where that number came from. More concerning, many media ratings are based purely on subjective impressions of a single match, lacking objective grounding. A single game is subject to too many random factors and cannot truly reflect a player’s or team’s overall form.
Through in-depth research into football data, we found that matches contain rich multi-dimensional information capable of supporting more granular rating systems and data reports. We categorize data into static data and dynamic data, and based on static data we build the following six sub-dimension scores:
- Attack
- Passing
- Defense
- Ball Progression
- Discipline
- Availability
Similar rating dimensions can be found on platforms like WhoScored, FotMob, and Sofascore. For a more complete foundational data API service, visit Futrix Metrics.
However, there is a pervasive bias in static data evaluation: attacking events tend to be overvalued, while defensive contributions and off-ball runs are chronically undervalued. A centre-back who maintains correct positioning, compresses space, and disrupts passing lanes for 90 minutes—if no “visible event” occurs throughout—will typically end up with an unremarkable score.
We optimize the weighting and calculation of static data from multiple angles while avoiding outcome-biased analysis of individual matches. A season-level form assessment is both more accurate and fairer to players. See: Rating & Player Cluster
The fundamental limitation of static data is this: it only records outcomes, not the decision-making process. Goals, shots, passes—these are all events recorded after the fact, revealing nothing about the judgment a player exercised before acting. This is exactly where dynamic data comes in.
Our expansion into dynamic data covers two layers: event data visualization and tracking data. Using a simulated match of 22 players as an example, and through seven analytical modules (M1–M7), this system analyzes not “what happened” but the quality of each decision: Was this pass directed correctly? Can the player stay composed under high-press pressure? When a better option was available, why wasn’t it taken?
| Global Stats | Value |
|---|---|
| Total Events | 1,500 |
| Tracking Data Rows | 118,800 |
| Total Players | 22 (Home 11 / Away 11) |
| Time Covered | 0–61 minutes |
| Overall Action Success Rate | 50.7% |
| Reasonable Decision Rate (team-wide) | 48.8% |
| Unreasonable Decision Rate (team-wide) | 46.0% |
| Suboptimal Decision Rate (team-wide) | 5.2% |
The above is an overview of demo data from this simulated match. Futrix Metrics is continuously collecting and integrating more professional data sources to further improve the precision and coverage of our models.
M1 — Tactical Route Asset Table
What is this module analyzing?
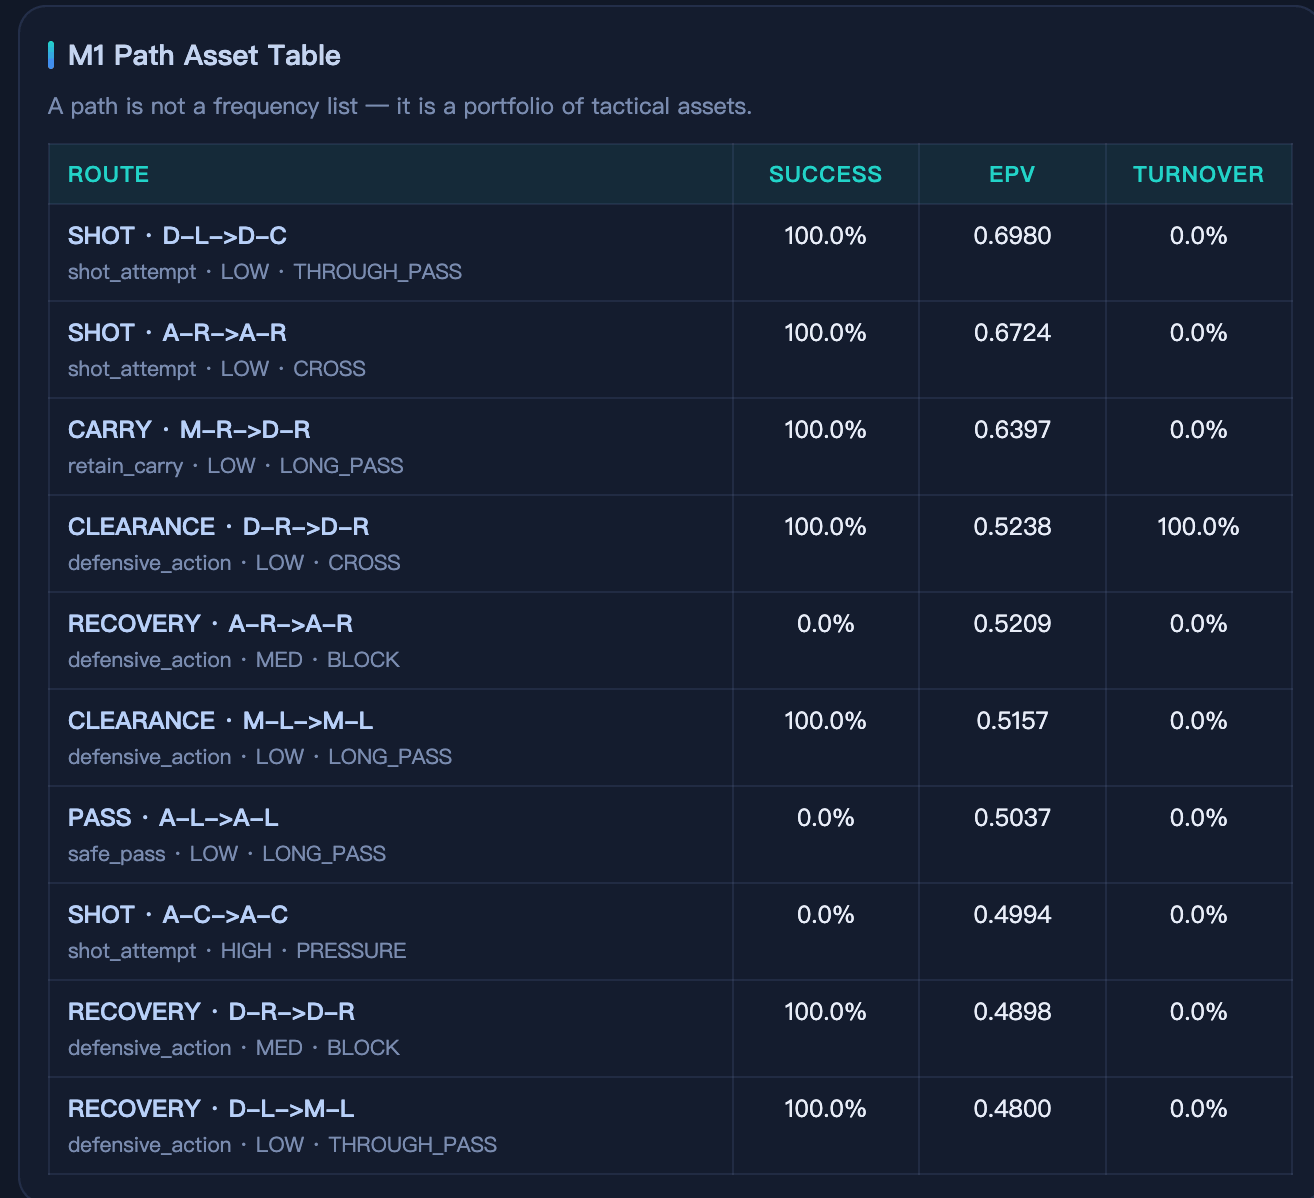
Simply put, M1 breaks down every action on the pitch into a “route record”—which zone it started from, what action was performed, where it went, and how much pressure was present. Once a route is identified, the system assigns it a value score (EPV), indicating: how much does this route help the team’s progression?
The route format is: Action Type | Starting Zone → Target Zone | Decision Type | Pressure Level | Action Sub-type
The pitch is divided into nine zones: three depths (Defensive / Midfield / Attacking) × three horizontal bands (Left / Centre / Right).
Full-match Findings
A total of 1,000 distinct route types were identified across the match, with none being systematically and repeatedly exploited at high efficiency—indicating that neither side has established a reliable “signature pattern” in their tactical play.
Player Route Asset Data
| Player | Position | Events Involved | Routes | Unique Route Types | Top Asset EPV | Top Asset Success Rate |
|---|---|---|---|---|---|---|
| HOME_1 | GK | 75 | 70 | 73 | 0.6993 | 100% |
| HOME_2 | CB | 51 | 50 | 50 | 0.8349 | 100% |
| HOME_3 | CB | 63 | 61 | 63 | 0.8236 | 100% |
| HOME_4 | LB | 69 | 67 | 69 | 0.8356 | 100% |
| HOME_5 | RB | 69 | 67 | 66 | 0.7877 | 100% |
| HOME_6 | CM | 64 | 63 | 62 | 0.8151 | 100% |
| HOME_7 | CM | 74 | 70 | 71 | 0.6980 | 100% |
| HOME_8 | CM | 66 | 63 | 64 | 0.7372 | 100% |
| HOME_9 | LW | 64 | 58 | 63 | 0.7801 | 100% |
| HOME_10 | RW | 80 | 77 | 78 | 0.7643 | 100% |
| HOME_11 | ST | 67 | 64 | 66 | 0.8302 | 100% |
| AWAY_1 | GK | 67 | 67 | 65 | 0.8279 | 100% |
| AWAY_2 | CB | 67 | 66 | 65 | 0.6767 | 100% |
| AWAY_3 | CB | 85 | 80 | 83 | 0.7612 | 100% |
| AWAY_4 | LB | 78 | 75 | 75 | 0.7303 | 100% |
| AWAY_5 | RB | 68 | 65 | 67 | 0.7730 | 100% |
| AWAY_6 | CM | 65 | 60 | 64 | 0.8120 | 100% |
| AWAY_7 | CM | 73 | 70 | 71 | 0.7516 | 100% |
| AWAY_8 | CM | 62 | 60 | 58 | 0.8143 | 100% |
| AWAY_9 | LW | 58 | 56 | 56 | 0.6925 | 0% |
| AWAY_10 | RW | 61 | 59 | 60 | 0.7553 | 100% |
| AWAY_11 | ST | 74 | 69 | 73 | 0.8291 | 100% |
Key Observations
AWAY_3 (CB) was involved in the most events (85) and had the widest range of route types (83)—this centre-back covers an exceptionally broad area with a highly varied play style.
HOME_4 (LB) has the highest top-asset EPV in the match (0.8356). This route is a defensive recovery action on the left side of midfield, executed at 100% success rate every time—his baseline action in this position is extremely reliable.
AWAY_9 (LW) has a serious problem: the most valuable route the system identified for this player has a success rate of 0%. The route direction is correct, but every attempt along this route has failed—indicating a clear technical execution shortfall that requires targeted training.
M2 — Decision Quality Gap
What is this module analyzing?
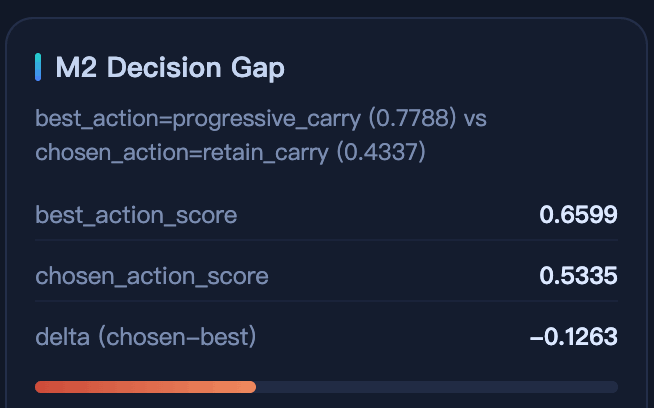
Each time a player acts, the system simultaneously calculates “what was the best choice available at that moment,” then compares what the player actually chose against that optimal option. The smaller the gap, the more accurate the player’s decision-making; the larger the gap, the more opportunity is being wasted.
Decision outcomes fall into three categories:
- Reasonable: The chosen direction is correct
- Suboptimal: The direction isn’t wrong, but a better option was overlooked
- Unreasonable: This action shouldn’t have been taken at all
Player Decision Quality Rankings
| Player | Position | Avg Decision Quality | Optimal Action Score | Actual Action Score | Gap Δ | Reasonable % | Unreasonable % |
|---|---|---|---|---|---|---|---|
| HOME_9 | LW | 0.5431 | 0.6871 | 0.5870 | -0.1002 | 54.7% | 39.1% |
| HOME_6 | CM | 0.5316 | 0.6206 | 0.4851 | -0.1355 | 53.1% | 40.6% |
| AWAY_6 | CM | 0.5285 | 0.6417 | 0.5132 | -0.1285 | 56.9% | 38.5% |
| HOME_7 | CM | 0.5280 | 0.6254 | 0.5014 | -0.1240 | 52.7% | 41.9% |
| HOME_5 | RB | 0.5241 | 0.6277 | 0.5170 | -0.1107 | 52.2% | 42.0% |
| AWAY_4 | LB | 0.5199 | 0.5930 | 0.4777 | -0.1153 | 52.6% | 41.0% |
| AWAY_1 | GK | 0.5189 | 0.5882 | 0.4925 | -0.0957 | 52.2% | 43.3% |
| AWAY_5 | RB | 0.5142 | 0.5862 | 0.4986 | -0.0876 | 52.9% | 38.2% |
| AWAY_2 | CB | 0.5116 | 0.6306 | 0.4542 | -0.1763 | 49.2% | 49.2% |
| HOME_7 | CM | 0.5280 | 0.6254 | 0.5014 | -0.1240 | 52.7% | 41.9% |
| AWAY_8 | CM | 0.5195 | 0.6707 | 0.4591 | -0.2116 | 45.2% | 54.8% |
| AWAY_3 | CB | 0.4516 | 0.5927 | 0.4593 | -0.1333 | 40.0% | 51.8% |
Key Observations
HOME_9 (LW) is the most accurate decision-maker on the team—not only does he have the highest average score, but the gap between his actual choices and the optimal ones is relatively small, indicating highly attuned situational awareness.
AWAY_8 (CM) is the most concerning player on the team: over half of his actions (54.8%) are rated unreasonable, and the gap between his actual choices and the optimal ones (Δ = -0.2116) is the largest on the team. This isn’t occasional poor judgment—it’s systematic poor decision-making, and something the coaching staff should monitor closely.
AWAY_2 (CB) and AWAY_7 (CM) have nearly equal splits between reasonable and unreasonable decisions—not a lack of ability, but inconsistency. Highly variable performance from one moment to the next.
M3 — Fatigue and Pressure Management
What is this module analyzing?
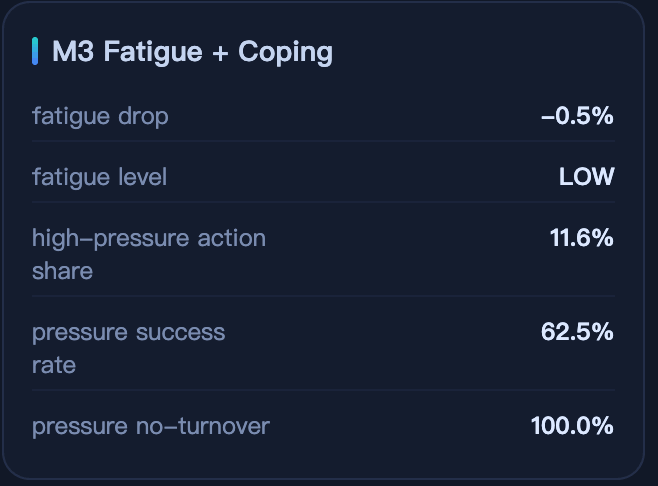
M3 has two parts: first, whether a player slows down or deteriorates as the match progresses (fatigue indicators); second, whether a player can hold their composure under high-press pressure (pressure handling).
Fatigue Analysis
This match only lasted 61 minutes, and all 22 players recorded a fatigue level of LOW, with minimal speed differences between the first and second half. However, a few details are worth noting:
| Player | Position | Early Speed (m/s) | Late Speed (m/s) | Change |
|---|---|---|---|---|
| AWAY_9 | LW | 3.343 | 3.555 | Actually accelerated in second half +6.3% |
| HOME_2 | CB | 3.587 | 3.428 | Declined 4.4% |
| HOME_8 | CM | 3.503 | 3.367 | Declined 3.9% |
| HOME_11 | ST | 3.560 | 3.425 | Declined 3.8% |
| AWAY_4 | LB | 3.455 | 3.330 | Declined 3.6% |
AWAY_9 actually ran faster in the second half—this kind of “warming up” pattern is relatively rare. It may reflect a tactical adjustment or a conservative energy distribution early on. Verification across a full-match dataset would be needed.
Pressure Handling Analysis
The key question here is: when opponents close down, can this player handle the ball well?
| Player | Position | Actions Under High Press | Press Exposure % | Success Rate Under Pressure | Ball Retention Rate Under Pressure |
|---|---|---|---|---|---|
| HOME_7 | CM | 11 | 14.9% | 75.0% | 91.7% |
| HOME_8 | CM | 8 | 12.1% | 75.0% | 75.0% |
| HOME_9 | LW | 13 | 20.3% | 69.2% | 69.2% |
| HOME_4 | LB | 8 | 11.6% | 62.5% | 100.0% |
| AWAY_6 | CM | 7 | 10.8% | 42.9% | 100.0% |
| AWAY_4 | LB | 8 | 10.3% | 62.5% | 100.0% |
| AWAY_8 | CM | 7 | 11.3% | 57.1% | 100.0% |
| HOME_11 | ST | 8 | 11.9% | 25.0% | 62.5% |
| AWAY_9 | LW | 10 | 17.2% | 20.0% | 80.0% |
HOME_7 (CM) has the strongest pressure resistance on the team: when pressed intensely, 75% of his actions are handled successfully, and 91.7% of the time he retains possession—the best combined figure on the team.
AWAY_9 (LW) stands out negatively: his press exposure frequency is substantial (17.24%), yet his success rate under pressure is only 20%—essentially breaking down every time he’s pressed. If the opposition targets this position with a high press, the Away team will suffer greatly.
HOME_4, AWAY_6, AWAY_4, and AWAY_8 all achieve 100% ball retention under pressure—even when the action isn’t fully successful, they always keep hold of the ball. Excellent ball-shielding awareness.
M4 — Counterfactual Decision Simulation
What is this module analyzing?
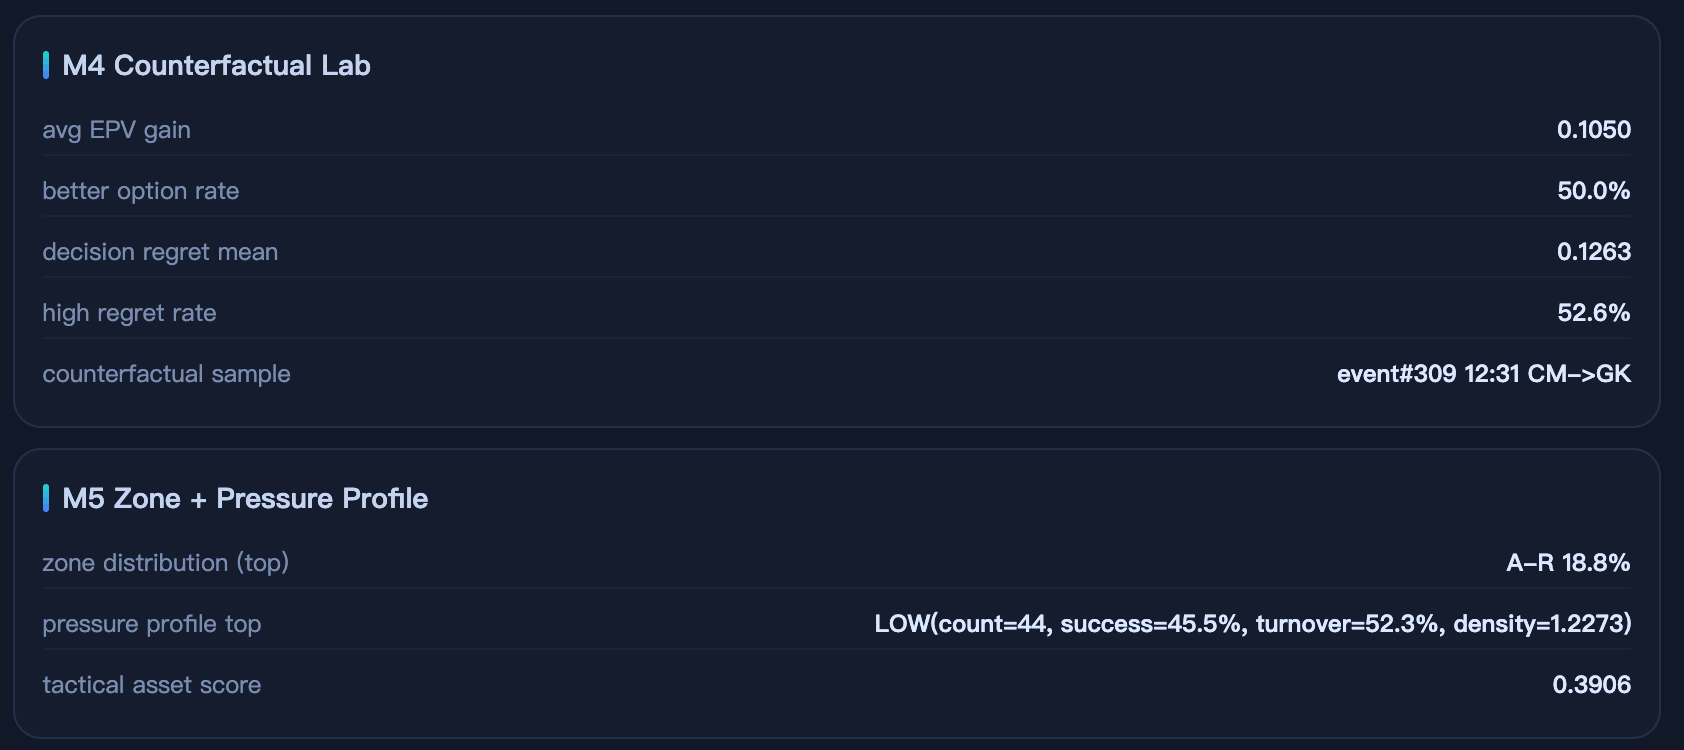
This is the most interesting module in the system. Every time a player passes, the system asks: “If he had chosen a different teammate or a different passing lane, how much difference would it have made?”
This difference is called “decision regret”—the higher the regret, the more valuable the better option he passed up.
Player Counterfactual Data
| Player | Position | Pass Samples | Avg EPV Gain | Better Option Available % | Avg Decision Regret | High-Regret Rate |
|---|---|---|---|---|---|---|
| AWAY_7 | CM | 12 | 0.1613 | 58.3% | 0.1706 | 50.0% |
| HOME_4 | LB | 10 | 0.1050 | 50.0% | 0.1263 | 52.6% |
| HOME_1 | GK | 9 | 0.1484 | 44.4% | 0.1579 | 47.1% |
| AWAY_6 | CM | 9 | 0.0442 | 44.4% | 0.1285 | 45.0% |
| AWAY_3 | CB | 7 | 0.1405 | 42.9% | 0.1333 | 52.6% |
| HOME_9 | LW | 6 | 0.1652 | 33.3% | 0.1002 | 35.7% |
| AWAY_1 | GK | 5 | 0.1619 | 40.0% | 0.0957 | 36.4% |
| AWAY_8 | CM | 6 | 0.0000 | 0.0% | 0.2116 | 66.7% |
| HOME_11 | ST | 6 | 0.1014 | 33.3% | 0.1560 | 53.8% |
| AWAY_11 | ST | 10 | 0.0060 | 0.0% | 0.1594 | 56.3% |
| HOME_7 | CM | 11 | 0.0142 | 9.1% | 0.1240 | — |
| HOME_5 | RB | 9 | 0.0097 | 11.1% | 0.1107 | 23.1% |
Most Telling “What If He’d Passed There” Cases
| Event # | Player | Match Time | Actual Target | Optimal Target | Value Difference (ΔEPV) |
|---|---|---|---|---|---|
| #943 | HOME_9 | 38:43 | CB position | RW position | +0.496 |
| #762 | AWAY_1 | 31:26 | CB position | CM position | +0.405 |
| #480 | AWAY_7 | 19:44 | CB position | CM position | +0.368 |
| #1379 | HOME_11 | 56:25 | CM position | LB position | +0.346 |
| #847 | HOME_1 | 35:02 | ST position | CM position | +0.349 |
| #861 | HOME_8 | 35:42 | RB position | CM position | +0.335 |
| #568 | AWAY_2 | 23:19 | ST position | LB position | +0.338 |
| #49 | AWAY_3 | 02:03 | ST position | CM position | +0.361 |
Key Observations
AWAY_7 (CM) had better options available for over half his passes (58.3%)—this is not occasional lapses in concentration but a persistent route-selection problem that requires dedicated tactical training to address passing lane choices.
HOME_9 (LW) missed the single biggest opportunity in the match at 38:43—he passed to the centre-back, but the system shows a pass to the right winger would have generated 0.496 more expected possession value—almost the largest single “what a waste” moment of the match. However, HOME_9’s overall decision quality still leads the team; this was an exception.
AWAY_8 (CM) is unusual: the system finds no better option available for him (0% better option rate), yet his decision regret is the highest on the team (0.2116), with a high-regret rate of 66.7%. This suggests the problem is not “choosing the wrong direction” but “executing that direction very poorly”—it’s an execution issue, not a judgment issue.
M5 — Zone Distribution and Pressure Profile
What is this module analyzing?
M5 answers two questions: Where does this player typically operate on the pitch? And how does his performance vary under different pressure conditions?
The system uses a “Tactical Asset Score” to comprehensively evaluate a player’s spatial coverage efficiency—the higher the score, the more valuable his positioning and movement are to the team.
Tactical Asset Score Rankings
| Player | Position | Tactical Asset Score | Primary Zone | Low-Pressure Success Rate |
|---|---|---|---|---|
| AWAY_4 | LB | 0.5469 | Defensive Right (19.2%) | 52.2% |
| AWAY_8 | CM | 0.4898 | Defensive Centre (16.1%) | 48.4% |
| AWAY_10 | RW | 0.4321 | Attacking Centre (16.4%) | 56.3% |
| HOME_5 | RB | 0.4082 | Defensive Centre (18.8%) | 61.8% |
| HOME_4 | LB | 0.3906 | Attacking Right (18.8%) | 45.5% |
| HOME_8 | CM | 0.3750 | Midfield Right (15.2%) | 37.5% |
| HOME_2 | CB | 0.3500 | Defensive Right (25.5%) | 41.7% |
| HOME_1 | GK | 0.3061 | Evenly distributed across zones (17.3% each) | 55.8% |
| HOME_7 | CM | 0.2500 | Attacking Centre (16.2%) | — |
| AWAY_11 | ST | 0.2500 | Midfield Right (17.6%) | 48.8% |
| HOME_6 | CM | 0.1276 | Defensive Right (17.2%) | — |
| AWAY_1 | GK | 0.0625 | Midfield Centre (19.4%) | 54.3% |
Key Observations
AWAY_4 (LB) has the highest Tactical Asset Score in the match (0.5469). His activity spans the defensive right, defensive left, midfield centre, and attacking right—a wide vertical range with effective contributions in each zone. This is the archetypal movement profile of a modern attacking full-back.
HOME_5 (RB) is the highest-scoring player in the home team tactically (0.4082), operating from a defensive centre base but also pushing forward into the attacking right to provide consistent overlapping runs.
HOME_11 (ST) has the lowest Tactical Asset Score among outfield players (0.0938), and more tellingly, he spends a large share of his time in the defensive left zone (17.9%)—a striker regularly appearing in defensive zones means he’s failing to threaten in the attacking areas where he should be most dangerous. His movement patterns are misaligned with his intended role.
AWAY_1 (GK) having the lowest score (0.0625) is entirely normal, as goalkeepers are naturally restricted in their movement. However, his primary zone concentration in midfield centre (19.4%) suggests this is a sweeper-keeper who actively participates in build-up play.
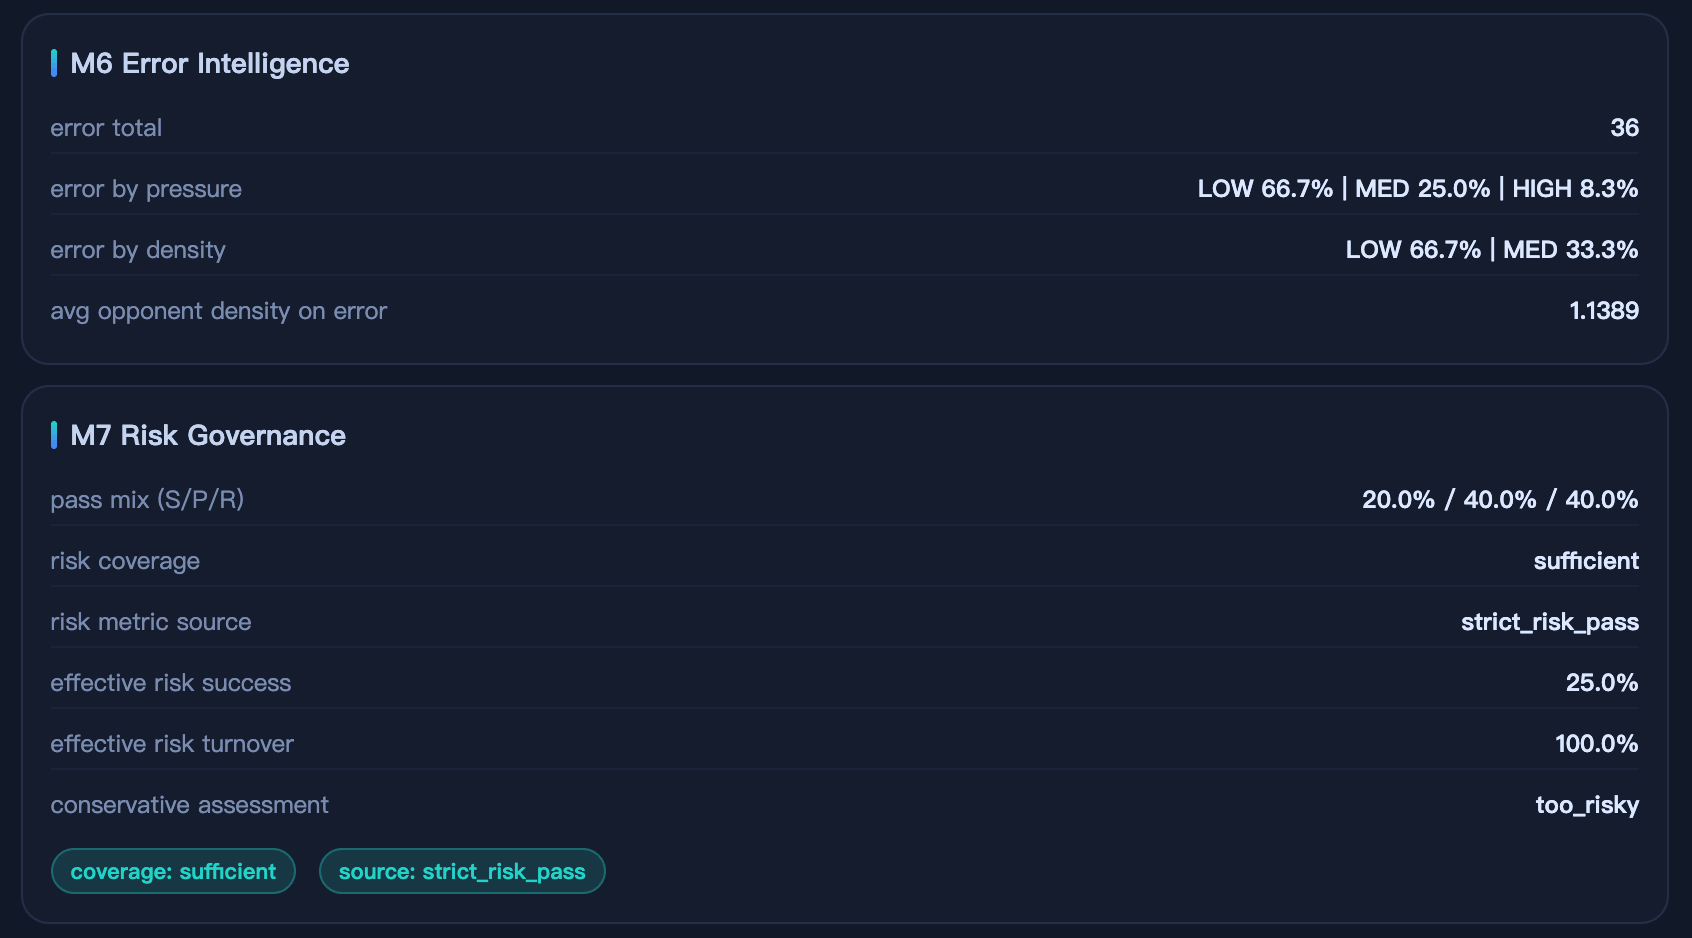
M6 — Error Intelligence Analysis
What is this module analyzing?
M6 doesn’t simply count errors—it analyzes why each error occurred. Every error is tagged by type: was it caused by being pressed, a technical shortfall in the player’s own execution, a wrong decision about which action to take, or failure to spot a better option?
Error types are currently categorized into four kinds (the exact taxonomy will depend on what data becomes available):
- Pressure Error: The opponent presses and the player cannot handle it
- Technical Error: No one is pressing, but the player makes a mistake on their own
- Decision Error: The wrong action type was chosen
- Vision Error: A better passing lane was not identified
Team-Wide Error Type Distribution (Global)
| Error Type | Proportion |
|---|---|
| Pressure Error | 47.8% |
| Technical Error | 45.7% |
| Decision Error | 3.5% |
| Vision Error | 3.0% |
Pressure errors and technical errors account for nearly equal halves—indicating the team has significant deficiencies in both handling opponents’ pressing and basic technical execution. This cannot simply be attributed to “the opposition pressing too hard.”
Individual Player Error Profiles
| Player | Position | Total Errors | Pressure Error% | Technical Error% | Decision Error% | Vision Error% | Avg Opponent Density at Error |
|---|---|---|---|---|---|---|---|
| AWAY_3 | CB | 51 | 45.1% | 54.9% | 0.0% | 0.0% | 1.510 |
| HOME_10 | RW | 43 | 53.5% | 39.5% | 0.0% | 7.0% | 1.163 |
| AWAY_11 | ST | 41 | 41.5% | 51.2% | 7.3% | 0.0% | 1.366 |
| HOME_11 | ST | 36 | 58.3% | 38.9% | 2.8% | 0.0% | 1.361 |
| AWAY_7 | CM | 36 | 41.7% | 50.0% | 5.6% | 2.8% | 1.833 |
| HOME_1 | GK | 35 | 54.3% | 45.7% | 0.0% | 0.0% | 1.200 |
| HOME_4 | LB | 36 | 38.9% | 47.2% | 8.3% | 5.6% | 1.139 |
| HOME_8 | CM | 33 | 27.3% | 66.7% | 3.0% | 3.0% | 1.394 |
| AWAY_6 | CM | 29 | 31.0% | 65.5% | 3.5% | 0.0% | 1.586 |
| AWAY_10 | RW | 30 | 66.7% | 23.3% | 6.7% | 3.3% | 1.400 |
| HOME_6 | CM | 28 | 57.1% | 28.6% | 3.6% | 10.7% | 1.536 |
| HOME_9 | LW | 26 | 57.7% | 38.5% | 0.0% | 3.9% | 1.231 |
Key Observations
AWAY_3 (CB) commits the most errors on the team (51 total), with over half being technical errors—meaning he frequently makes mistakes even without significant pressure. Combined with an average of 1.51 opponents nearby when he errs, he tends to break down technically in physical contest situations. Targeted training in shielding and receiving is needed.
AWAY_7 (CM)‘s error environment is the most extreme on the team: when he makes a mistake, there are on average 1.833 opponents nearby—almost the highest density of any player. This doesn’t necessarily mean his technique is poor; it suggests he frequently finds himself in extremely difficult positions, indicating a positioning logic problem.
AWAY_10 (RW) has the highest pressure error rate on the team (66.7%)—two-thirds of his errors are caused directly by opponent pressing. If the opposition deploys a targeted high press against him, he will struggle greatly.
HOME_8 and AWAY_6 (both CM) each have technical error rates exceeding 65%, and neither operates in particularly crowded conditions when they make mistakes—meaning these two central midfielders are technically unstable even in relatively comfortable situations. This is unusual and particularly concerning for midfielders, who should be capable of executing cleanly when given time and space.
HOME_9 (LW) commits the fewest errors on the team (just 26), while also having a relatively high press exposure rate in M3 (20.3%)—indicating he is the type of player who “stays composed even when pressured.” He is the most technically stable player on the team.
M7 — Risk Governance
What is this module analyzing?
M7 profiles each player’s “risk appetite.” Passes are categorized into three types:
- Safe Pass: Passing to a safe direction without taking risks
- Progressive Pass: Moving the ball forward within reasonable parameters
- Risk Pass: High-risk passing that may create opportunities but also risks losing possession
The system’s evaluation criterion is: does this player’s risk-taking match their execution capability? Taking risks is acceptable—but the risks must be worth taking.
Player Risk Profiles
| Player | Position | Safe Pass% | Progressive Pass% | Risk Pass% | Optimal Decision Rate | Pressure Error Rate | Risk Assessment |
|---|---|---|---|---|---|---|---|
| AWAY_7 | CM | 66.7% | 16.7% | 16.7% | 50.7% | 41.7% | balanced |
| HOME_10 | RW | 50.0% | 25.0% | 25.0% | 48.7% | 53.5% | balanced |
| AWAY_6 | CM | 11.1% | 66.7% | 22.2% | 56.9% | 31.0% | balanced |
| HOME_7 | CM | 36.4% | 36.4% | 27.3% | 52.7% | 46.9% | balanced |
| HOME_9 | LW | 33.3% | 33.3% | 33.3% | 54.7% | 57.7% | balanced |
| HOME_3 | CB | 37.5% | 25.0% | 37.5% | 46.0% | 55.9% | too_risky |
| HOME_4 | LB | 20.0% | 40.0% | 40.0% | 40.6% | 38.9% | too_risky |
| AWAY_11 | ST | 20.0% | 40.0% | 40.0% | 46.0% | 41.5% | too_risky |
| AWAY_9 | LW | 0.0% | 25.0% | 75.0% | 53.4% | 51.6% | (extreme risk) |
| AWAY_3 | CB | 57.1% | 14.3% | 28.6% | 40.0% | 45.1% | balanced |
| HOME_11 | ST | 50.0% | 33.3% | 16.7% | 41.8% | 58.3% | balanced |
| HOME_1 | GK | 44.4% | 55.6% | 0.0% | 53.3% | 54.3% | insufficient data |
Key Observations
AWAY_9 (LW) has the most extreme risk profile on the team: 75% of his passes are high-risk choices. The problem isn’t that he takes risks—it’s that his success rate under pressure is only 20% (per M3 data). Taken together, this means he frequently attempts high-risk passes and fails most of the time. The risk-reward ratio here is severely imbalanced.
AWAY_6 (CM) is the most risk-efficient player on the team: progressive passes dominate his profile (66.7%), his optimal decision rate leads the entire team (56.9%), and his pressure error rate is the lowest among midfielders (31.0%). Every forward step he takes is a calculated one.
HOME_3 (CB) and HOME_4 (LB) are both flagged as “too risky”—both defensive players have high-risk passing proportions between 37.5% and 40%. Centre-backs and left-backs attempting high-risk passes deep in their own half create direct danger when possession is lost. HOME_4’s risk pass turnover rate is 100%—every single high-risk attempt resulted in a loss of possession. Completely counterproductive.
HOME_7 (CM) is the most balanced midfielder overall: risk distribution of 33%/36%/27% (safe/progressive/risk), optimal decision rate of 52.7%, combined with the team’s best pressure handling data from M3—this is a technically mature central midfielder who makes correct decisions even under intense pressure.
HOME_11 (ST) has the highest pressure error rate among forwards (58.3%) and an optimal decision rate of only 41.8% with a poor decision rate of 53.7%—indicating both poor judgment and poor execution in high-pressure situations. He is the forward who needs the most coaching attention.
Overall Conclusion: Who Were the Key Players in This Match?
Standout Performers
| Player | Position | Core Strengths | Areas to Monitor |
|---|---|---|---|
| HOME_7 | CM | Best pressure resistance on team (75% success + 91.7% retention); balanced risk; strong tactical coverage | Mid-range decision gap (Δ=-0.124) |
| AWAY_6 | CM | Highest optimal decision rate (56.9%); lowest pressure error rate; zero ball losses under pressure | Tactical asset score slightly lower (0.1837) |
| HOME_9 | LW | Highest decision quality average (0.5431); fewest errors on team (26); composed under pressure | Missed the biggest counterfactual opportunity (ΔEPV=+0.496) |
| AWAY_4 | LB | Highest tactical asset score (0.5469); zero ball losses under pressure; 52.6% reasonable decision rate | No better option found in M4 but high regret rate |
Players Requiring Close Attention
| Player | Position | Core Issues |
|---|---|---|
| AWAY_8 | CM | Largest decision gap on team (Δ=-0.2116); 54.8% of actions unreasonable; high-regret rate 66.7% |
| AWAY_9 | LW | 75% of passes are high-risk; only 20% success rate under pressure; systematic imbalance |
| HOME_11 | ST | 58.3% pressure error rate; movement patterns drift away from attacking core zones; below-average decision quality |
| AWAY_3 | CB | Most errors on team (51); predominantly technical errors; over half of decisions unreasonable |
| AWAY_7 | CM | Better option available in 58.3% of passes (team high); repeatedly makes mistakes in most congested areas |
Data Notes
Data Source: This analysis is based on simulated tracking and event data. Route EPV calculations use approximate spatial context; once real tracking data for 22 players is integrated, the precision of zone possession value estimates will improve significantly.
Route Asset Scoring: Both route success rates and EPV values are single-match samples. Some high-EPV routes have small sample sizes (n=1) and should be treated as directional reference points rather than statistically robust conclusions.
Decision Quality Gap (M2): Optimal action scores are calculated based on simulated teammate and opponent positions. Once real defensive formations and press-trigger conditions are integrated, the discriminatory power of this metric will improve further.
Counterfactual Analysis (M4): The “optimal role” in counterfactual cases refers to the ideal type of pass recipient role, not a recommendation to reposition the passer.
About the Project: These seven modules are not a fixed framework—they represent the analytical structure best suited to the current data. As data expands and deepens, the module configuration will continue to evolve. If your team or club wishes to receive customized analysis, you are welcome to provide proprietary data to us—we will apply our models to track player form, evaluate decision quality, and identify areas for improvement, helping your team perform better on the pitch.
FutrixMetrics Decision Intelligence System — Demo Analysis Report v1.0 Analysis Period: Minutes 0–61 | Data Type: Simulated Data