
What is xG in Football? Expected Goals Explained with Examples and Visualizations
Learn what xG (Expected Goals) means, how it's calculated, and why it matters. Includes xA, EPV, and other key football analytics metrics with visual examples.
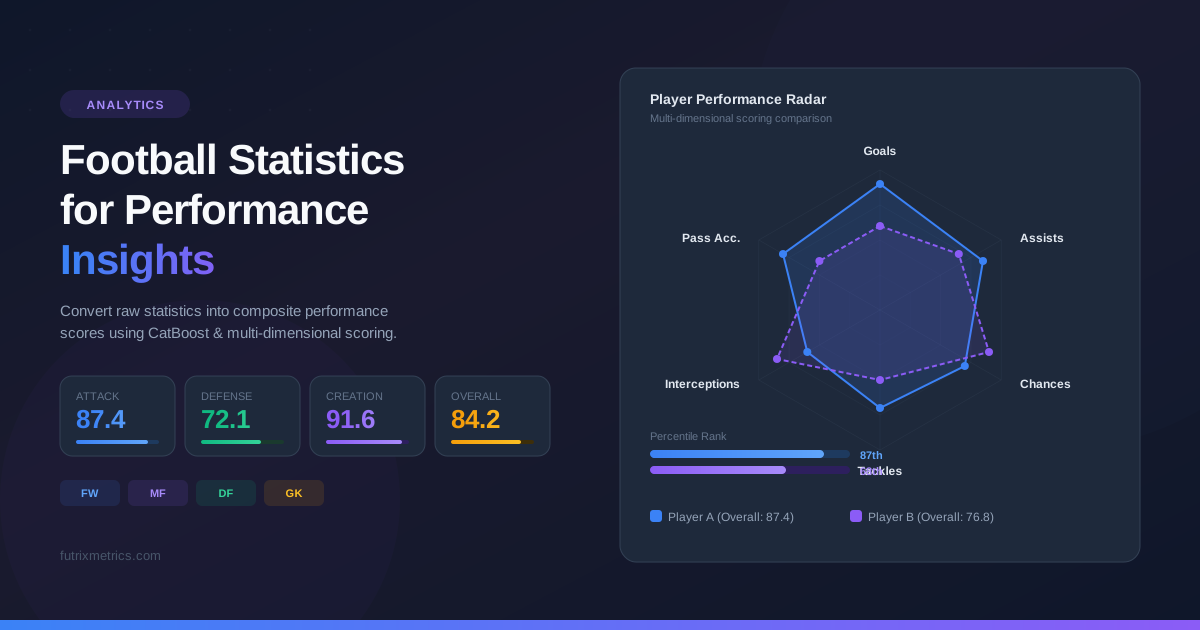
Football analytics has shifted from a niche discipline to a standard operating tool across professional clubs, media companies, and independent analysts. At the center of this shift sits a single metric: xG, or Expected Goals. If you have watched a post-match broadcast in the past five years, you have almost certainly seen xG referenced — but the metric is often presented without the context needed to interpret it correctly.
This guide breaks down what xG actually measures, how the underlying models work, and why xG alone is only the starting point. We also cover xA (Expected Assists), EPV (Expected Possession Value), and other metrics that complete the analytical picture, with practical examples using the Football Performance API so you can move from theory to working data in the same session.
For a deeper look at how these metrics feed into production systems, see the Comprehensive Guide to Football Data and the Football Statistics and Performance Analysis on the Futrix Metrics platform.
1) xG Defined: What Expected Goals Actually Measures
Expected Goals (xG) quantifies the probability that a given shot will result in a goal, based on historical data from tens of thousands of similar attempts. Each shot receives a value between 0 and 1. A penalty kick typically carries an xG of roughly 0.76. A header from outside the six-yard box after a corner might carry an xG of 0.04. A one-on-one opportunity with the goalkeeper at close range often exceeds 0.35.
The model considers contextual features at the moment the shot is taken:
- Shot location — distance and angle to the goal center.
- Body part — foot, head, or other.
- Assist type — through ball, cross, set piece, or open play buildup.
- Game state — score differential, minute of the match.
- Defensive context — number of defenders between shooter and goal (in advanced models).
A match where a team accumulates 2.3 xG means the collective quality of their chances, if repeated over thousands of simulations, would produce about 2.3 goals on average. The actual scoreline in any single match can deviate significantly — that deviation is precisely the analytical signal xG is designed to capture.
Why xG Matters for Decision-Making
Without xG, evaluating attacking performance relies on goals scored — an outcome metric that carries significant variance over small samples. A team might score five goals from three high-quality chances and two deflections, or score zero from seven well-constructed opportunities. Goals alone cannot distinguish between these scenarios. xG can.
This distinction has direct implications for coaching decisions. If a team consistently generates high xG but underperforms on actual goals, the underlying process (chance creation) is sound; the finishing is either unlucky or requires targeted intervention. If a team overperforms their xG consistently, coaching staff should prepare for regression rather than assume the scoring rate is sustainable.
For recruitment departments, xG isolates chance creation quality from finishing luck. A striker who scores 12 goals from 8.0 xG may be a clinical finisher — or may be benefiting from a small-sample hot streak. A forward who scores 8 goals from 12.0 xG is likely underperforming relative to their chance quality and may represent a buy-low opportunity if the cause is variance rather than declining ability.
2) How xG Models Are Built
At its core, an xG model is a supervised classification system. The training data consists of historical shots labeled with a binary outcome (goal or no goal). The model learns a mapping from shot features to scoring probability.
Training Data and Features
Most production xG models train on datasets containing 50,000 to 200,000+ shots with structured features. The minimum viable feature set includes:
| Feature | Description | Impact on xG |
|---|---|---|
| Distance to goal | Euclidean distance from shot location to goal center | Strong negative correlation |
| Shot angle | Angular width of the goal visible from shot location | Positive correlation |
| Body part | Foot, head, other | Headers have lower conversion |
| Shot type | Open play, free kick, corner, penalty | Penalties have fixed ~0.76 xG |
| Assist type | Through ball, cross, cutback, none | Through balls increase xG |
Advanced models incorporate additional contextual variables: defensive pressure indices, goalkeeper positioning, speed of play leading to the shot, and whether the chance originated from a counter-attack or set piece sequence.
Model Architecture Choices
Logistic regression served as the baseline xG model for years due to its interpretability. Modern implementations typically use gradient-boosted tree ensembles — specifically CatBoost or XGBoost — because these handle categorical features natively, capture non-linear interactions between shot context variables, and deliver measurably better calibration on held-out test sets.
The Football Performance API uses CatBoost as its core prediction engine across the platform. While the API does not expose a raw xG-per-shot endpoint, its composite scoring pipeline captures the same underlying signal at the player level. The attack_score_score_pct dimension within the ratings system reflects offensive output quality that inherently encodes chance creation and finishing patterns — the same phenomena xG quantifies at the event level, but aggregated and normalized for positional cohort comparison.
You can query these composite scores directly:
GET /database/ratings?position=CF&league=Premier League&season=2025-2026&limit=20This returns forward-specific ratings with attack scores already normalized against the positional baseline, giving you a decision-ready metric without needing to build and maintain your own xG model from scratch.
For the underlying feature-level data that feeds these scores, including goals, shots, shots on target, and assists:
GET /database/player-features?full_name=Mohamed Salah&league=Premier League&season=2025-2026&source=proThe source=pro parameter selects the enhanced feature engineering pipeline with proprietary normalization — the same pipeline described in the Player Rating and Role Clustering Model Design.
3) xA — Expected Assists: Measuring Chance Creation
Expected Assists (xA) assigns the xG value of the resulting shot to the player who provided the final pass. If a midfielder plays a through ball that sets up a shot worth 0.45 xG, the midfielder receives 0.45 xA for that action.
xA is critical for evaluating creative players because it separates the quality of chances they create from the finishing ability of their teammates. A playmaker might deliver consistently high xA while their striker converts at a below-average rate — making the playmaker’s actual assist numbers misleadingly low.
xA vs. Actual Assists
Consider two midfielders across a full season:
| Player | Actual Assists | xA | Difference |
|---|---|---|---|
| Player A | 14 | 9.2 | +4.8 |
| Player B | 6 | 10.8 | -4.8 |
Player A’s assist total flatters their creative output — their teammates finished well above expectation. Player B created higher-quality chances but was penalized by below-average finishing from teammates. If you were recruiting a creative midfielder based solely on assist counts, you would overvalue Player A and overlook Player B.
The Football Performance API captures this creative dimension through the creation_score_score_pct and assist_score_score_pct metrics available via the ratings and player features endpoints. These percentile-based scores quantify a player’s chance-creation quality relative to positional peers, providing the same analytical signal as xA but integrated into a broader multi-dimensional profile:
GET /database/ratings?position=AM&league=Premier League&season=2025-2026&limit=30For multi-player comparison, the overlay radar chart endpoint visualizes how different creative profiles stack up:
GET /player-charts/compare?player_ids=100,200,300&season=2025-2026&source=proThis returns a radar chart overlaying skill profiles, making it immediately visible whether a player’s creative strengths align with your tactical requirements. For a walkthrough of the full chart system, see the Futrix Metrics Charts Project.
4) EPV — Expected Possession Value: Beyond the Shot
Expected Possession Value (EPV) extends the logic of xG to every moment a team has the ball, not just when a shot occurs. EPV estimates the probability that the current possession will result in a goal given the ball’s location, the game state, and the tactical context.
Where xG asks “how likely is this shot to score?”, EPV asks “how likely is this possession to produce a goal from this point forward?” This shifts the analytical frame from shot quality to possession quality, enabling evaluation of actions that never directly lead to shots but significantly increase goal probability.
How EPV Works in Practice
A midfielder who receives the ball in their own half (EPV ~0.01) and plays a progressive pass into the opposition’s half (EPV ~0.04) has added 0.03 EPV through that single action. A winger who receives the ball in the final third (EPV ~0.06) and cuts inside to deliver a cross into a dangerous area (EPV ~0.12) has added 0.06 EPV.
EPV captures contributions that traditional statistics and even xG miss entirely:
- Ball progression — passes that move the ball into higher-value zones.
- Press resistance — retaining possession under pressure in midfield zones.
- Build-up contribution — involvement in possession sequences that lead to goal-scoring opportunities, even if the player is not the assister or shooter.
The Football Performance API’s progression_score_score_pct dimension captures this ball-progression signal at the player level. Players who consistently move the ball from low-value to high-value zones score highly on this metric, even if their goal and assist tallies are modest. Query it alongside other dimensions to build a complete picture:
GET /database/player-features?position=CM&league=Premier League&season=2025-2026&source=pro&limit=50For an in-depth exploration of possession-based analytical frameworks, the Football Decision Intelligence Report covers EPV-adjacent modules including tactical route analysis, decision quality gaps, and counterfactual simulation.
5) Beyond xG: The Full Metrics Landscape
xG, xA, and EPV are the most discussed metrics in modern football analytics, but the analytical toolkit extends further. Here is a reference map of the key metrics you will encounter.
Shooting and Chance Quality
| Metric | What It Measures | Use Case |
|---|---|---|
| xG | Shot scoring probability | Match analysis, team/player evaluation |
| xG per shot | Average chance quality | Distinguishes volume shooters from quality shooters |
| xGOT (xG on target) | Post-shot xG including shot placement | Isolates finishing skill from chance quality |
| Post-shot xG - pre-shot xG | Finishing skill above chance quality | Identifying clinical finishers |
Creation and Playmaking
| Metric | What It Measures | Use Case |
|---|---|---|
| xA | Chance quality created for teammates | Evaluating creative players independent of finishers |
| Key passes | Passes directly leading to a shot | Volume of chance creation |
| Progressive passes | Passes moving ball significantly toward goal | Build-up contribution |
| Shot-creating actions | Actions in the two events before a shot | Broader creative involvement |
Possession and Progression
| Metric | What It Measures | Use Case |
|---|---|---|
| EPV | Goal probability from current possession state | Valuing every on-ball action |
| EPV added | Change in EPV caused by an action | Identifying high-impact ball carriers |
| Progressive carries | Ball carries moving significantly toward goal | Evaluating dribblers and press-breakers |
| PPDA | Passes per defensive action | Team pressing intensity |
Defensive Metrics
| Metric | What It Measures | Use Case |
|---|---|---|
| xG against | Quality of chances conceded | Defensive performance evaluation |
| Tackles + interceptions per 90 | Defensive action frequency | Comparing defensive activity |
| Pressures | Attempts to pressure an opponent with the ball | Press contribution |
| Aerial win % | Proportion of aerial duels won | Set piece and cross defense |
The Football Performance API covers the player-level dimensions across these categories through its 13-dimension scoring system. The POST /score/predict endpoint accepts raw season statistics and returns scores across attack, shooting quality, assists, creation, passing, progression, dribbling, ball security, defense, aerial, discipline, appearance, and an overall rating prediction:
POST /score/predict
{
  "features": {
    "position": "CM",
    "season": "2025-2026",
    "league": "Premier League",
    "player_name": "Martin Odegaard",
    "club": "Arsenal",
    "minutes": 2400,
    "goals": 8,
    "assists": 10,
    "shots": 65,
    "shots_on_target": 28,
    "passes_completed": 1800,
    "passes_attempted": 2100,
    "tackles": 40,
    "tackles_won": 25,
    "interceptions": 30,
    "clearances": 12,
    "blocks": 8,
    "dribbles": 55,
    "dribbles_successful": 35,
    "aerials": 25,
    "aerials_won": 10,
    "fouls_committed": 18,
    "fouls_drawn": 45,
    "yellow_cards": 3,
    "red_cards": 0
  }
}
The response returns a scores_0_10 object with all 13 dimensions plus a cluster object identifying the player’s tactical archetype — a GMM-derived role label such as “Creative Playmaker” or “Box-to-Box Engine.” This multi-dimensional output is the practical successor to evaluating players through any single metric in isolation.
For visual exploration of how these dimensions distribute across positions and leagues, use the score distribution and scatter plot endpoints:
GET /player-charts/score-distribution?dim=creation_score_score_pct&source=pro&season=2025-2026
GET /player-charts/score-scatter?x_dim=creation_score_score_pct&y_dim=attack_score_score_pct&color_by=position&source=pro
6) Reading xG in Match Context: Practical Interpretation
Understanding xG as a concept is different from interpreting it correctly in match analysis. Here are the patterns that separate useful analysis from misleading conclusions.
Pattern 1: High xG, Low Goals — Process Is Sound
A team generates 2.1 xG but scores 0 goals. The immediate reaction is “they were wasteful.” The analytical interpretation is more nuanced: the team created chances equivalent to roughly two goals in expected value. Over a season, a team consistently generating 2.0+ xG per match will score — the variance simply went against them in this match. Coaching response: reinforce the process, do not overhaul the tactical approach based on a single-match outcome.
Pattern 2: Low xG, High Goals — Prepare for Regression
A team generates 0.6 xG but scores 3 goals. This suggests either exceptional finishing (a long-range screamer, a deflection, an error-induced goal) or that the xG model underestimates the chances (unusual situations not well-captured by the model). If this pattern repeats over multiple matches, the team is almost certainly overperforming and should expect a scoring regression. Coaching response: focus on improving chance creation quality rather than assuming current scoring rates will persist.
Pattern 3: xG Differential as a Season Predictor
The gap between xG created and xG conceded (xG difference) is one of the strongest predictors of league position over a full season — stronger than actual goal difference in the early portion of a campaign. A team with +0.8 xG difference per match is building a sustainable performance foundation regardless of their current points total.
You can explore these patterns across leagues and seasons using the Football Performance API’s league-level visualization:
GET /player-charts/league-scores?source=pro&season=2025-2026&top_leagues=10This heatmap shows average skill scores per league, helping contextualize xG-related metrics within different competitive environments. A 1.5 xG performance in the Premier League carries different weight than 1.5 xG in a lower-ranked league — the defensive quality faced is fundamentally different. The Premier League Stats analysis on Futrix Metrics provides league-specific benchmarks for this kind of contextual evaluation.
7) Common Misconceptions About xG
”xG Tells You Who Should Have Won”
xG describes chance quality, not match entitlement. A team with 3.0 xG that loses 0-1 created better chances, but football rewards goals, not expected goals. xG informs process evaluation, not retroactive result assignment.
”A Player’s xG Overperformance Means They’re a Great Finisher”
Sometimes. But finishing skill above xG tends to regress over time for most players. Only a small number of elite forwards — players like Messi at his peak — sustain meaningful xG overperformance across multiple seasons. For most players, a single season of xG overperformance is noise, not signal.
”xG Models Are All the Same”
Model quality varies dramatically depending on training data volume, feature engineering depth, and calibration methodology. A model trained on 10,000 shots from a single league will produce different (and likely worse) estimates than a model trained on 200,000+ shots across multiple competitions with advanced contextual features. Always consider the provenance of the xG numbers you consume.
”Low xG Means the Team Played Badly”
Not necessarily. Some tactical approaches — deep-block counterattacking, set-piece specialization — are designed to produce fewer but higher-quality chances. A team that generates 0.9 xG from five shots (0.18 xG per shot) may be executing a deliberate tactical plan more effectively than a team generating 1.5 xG from 20 shots (0.075 xG per shot). xG per shot, not total xG alone, tells the chance quality story.
8) From Metrics to Workflow: Putting It All Together
Understanding xG, xA, and EPV as isolated concepts is the foundation. The analytical step is integrating these metrics into a repeatable workflow that produces decisions, not just numbers.
A practical workflow for player evaluation:
- Screen — Use the API to pull top-rated players by position and league, filtered by composite scores that encode xG-level signals.
- Profile — Generate radar charts comparing shortlisted players across all 13 scoring dimensions.
- Cluster — Check each player’s tactical role assignment to ensure their archetype matches your system requirements.
- Predict — Feed current-season statistics into the prediction endpoint to project performance levels.
- Report — Generate a shareable scouting report for stakeholder review.
GET /database/ratings?position=CF&league=La Liga&season=2025-2026&limit=50
GET /player-charts/radar/{player_id}?season=2025-2026&source=pro
GET /database/role-cluster-results?player_id={player_id}
GET /report?player_id={player_id}&season=2025-2026
This four-query sequence takes you from a broad screening pool to a detailed individual scouting report — the entire evaluation pipeline, powered by API calls that any analyst with basic programming knowledge can automate. For a visual walkthrough of this workflow, explore the Futrix Metrics Platform Guide and the Rating and Player Cluster Project.
9) Getting Started: Your First Steps with Football Analytics Metrics
If you are new to football analytics and want to move beyond reading about xG to working with it:
-
Explore the platform — Futrix Metrics provides a no-code interface for searching players, comparing stats, and generating AI scouting reports without any programming.
-
Try the API — The Football Performance API Playground lets you test endpoints interactively before writing a single line of code.
-
Read the documentation — The full API reference covers every endpoint, parameter, and response schema with examples.
-
Check the pricing — The Futrix Metrics Service Plans start at a free tier, so you can experiment with real data at zero cost.
-
Go deeper — The Football Decision Intelligence Report explores advanced analytical modules including counterfactual simulation, fatigue management, and risk governance frameworks that build on the foundational metrics covered here.
Football analytics is not about replacing intuition with numbers. It is about giving scouts, coaches, analysts, and fans a shared language for evaluating what they see on the pitch — and xG is where that language begins.