Stop Waiting for a Developer — Explore Football Data Right Now
Discover how Futrix Metrics Explorer lets football fans and non-technical users instantly access player reports, stats, comparisons, and charts — no coding required. Just your API key and a browser.
Stop Waiting for a Developer — Explore Football Data Right Now
There’s a version of football fandom most people never get to experience.
It’s the version where you don’t just watch the match — you understand it. Where you can pull up a full player performance profile in seconds, compare two strikers across five dimensions of skill, or see how a midfielder’s passing efficiency stacks up against every other player in the league. Where every transfer debate, every tactical argument, every “is he worth the money?” question has a real, data-backed answer you can look at on screen.
That version of football used to require a developer, a data pipeline, and a statistics degree. Not anymore.
Futrix Metrics Explorer is a no-code football analytics platform that opens the full power of professional player data to anyone with a browser and an API key. You don’t write code. You don’t set up servers. You don’t wait for someone on the tech team to build you a dashboard. You just connect, search, and explore.
If you’ve ever wanted to know exactly how good Mohamed Salah really is — with a score, a radar chart, and a role classification to back it up — this platform was built for you.
What Is Futrix Metrics Explorer?
Futrix Metrics is a football intelligence platform that gives you access to a vast database of player statistics, performance scores, and role cluster data covering major leagues worldwide. The Futrix API is the engine that powers it — a football API platform used by developers and data teams to query player data programmatically.
But the Futrix Metrics Explorer is something different. It’s the visual layer built on top of that API — a fully interactive, browser-based football dashboard designed for people who want the insights without the infrastructure. No terminal windows, no JSON parsing, no script writing.
You get all the same data that developers pull through the API. You just get it in a format that makes instant sense: ratings, radars, heatmaps, role clusters, comparison charts, and AI-generated scout briefs. Everything is point-and-click. Everything is visual. Everything is fast.
This is soccer analytics for fans, journalists, coaches, and fantasy managers — delivered with the same depth that elite clubs use, at a fraction of the barrier to entry.
The Problem With Raw Football Data (And Why the Platform Solves It)
Football has never had more data. Tracking systems, event logs, expected goals models, per-90 metrics, positional clustering — the statistical layer of the modern game is richer and more detailed than ever before. Clubs at the top level employ full data science departments. Analytics consultancies charge tens of thousands for custom reports.
But for the vast majority of football fans, coaches, and content creators, accessing that data means hitting a wall: the technical wall.
The Futrix API delivers this data in raw form — clean, accurate, and comprehensive. But using it requires knowledge of HTTP requests, JSON parsing, query parameter formatting, and programming languages like Python or JavaScript. For the developers and data engineers the API is designed for, that’s second nature. For everyone else, it’s a locked door.
The Futrix Metrics Explorer is the key to that door.
It takes every data point the API exposes — overall ratings, dimensional scores, role classifications, per-90 stats, percentile rankings, and league-wide comparisons — and presents them through a football data visualization interface that anyone can read and navigate. No technical knowledge required. Just curiosity about the game.
Platform vs. API — What’s the Difference, and Which One Do You Need?
This is the most common question new users ask, and it deserves a clear answer.
| Futrix Metrics Explorer (Platform) | Futrix API (Raw Data) | |
|---|---|---|
| Who it’s for | Fans, journalists, scouts, coaches, fantasy managers | Developers, data scientists, analytics engineers |
| Technical skill needed | None — just your API key | Coding knowledge required |
| How you access it | Browser dashboard, fully visual, point-and-click | HTTP requests, code libraries, terminal |
| Output format | Visual reports, radar charts, heatmaps, comparison views | JSON data responses |
| Best for | Instant player research, visual storytelling, match prep | Building apps, bulk data processing, custom ML pipelines |
| Setup time | Under 2 minutes | Hours to days depending on project |
When to Use the API
The football API platform is ideal when you need to move large volumes of player data into your own systems. If you’re building a scouting app, creating a machine learning model to predict transfer value, or processing thousands of player records to populate a database — the API is the right tool. It gives you raw, structured access to every data point, which you can then process however your system requires. You can explore all available plans and API access on the Services page.
When to Use the Platform
If your goal is to understand players, compare options, generate reports, or create visualizations — without writing any code — the Explorer is what you need. It’s the ready-made football analytics platform that wraps the API’s power in a dashboard anyone can use.
Think of it this way: the API gives you the raw data. The Platform gives you the answer.
The good news is you don’t have to choose permanently. Both the API and the Explorer are accessible under the same account. Your API key — the same credential you’d use to make raw API requests — is what connects you to the Explorer dashboard. So as your needs grow, the tools grow with you.
Who Is Futrix Metrics Explorer For?
Football Fans Who Want More Than Box Scores
You watch every match. You know the starting XI, the tactical setup, the xG numbers posted on social media. You’re deep enough into football to care about whether a midfielder is genuinely progressive or just busy. But the tools that answer those questions have always felt out of reach — too technical, too expensive, too complex.
The Futrix Metrics Explorer changes that. It’s built from the ground up as soccer analytics for fans — powerful enough to give you real answers, simple enough that you don’t need any background in data science to use it.
Search any player by name, position, league, or season. Get their full performance report in seconds. See how they rated this season versus last season. Find out whether that new signing actually fits the role your club needs, or whether the hype is bigger than the data.
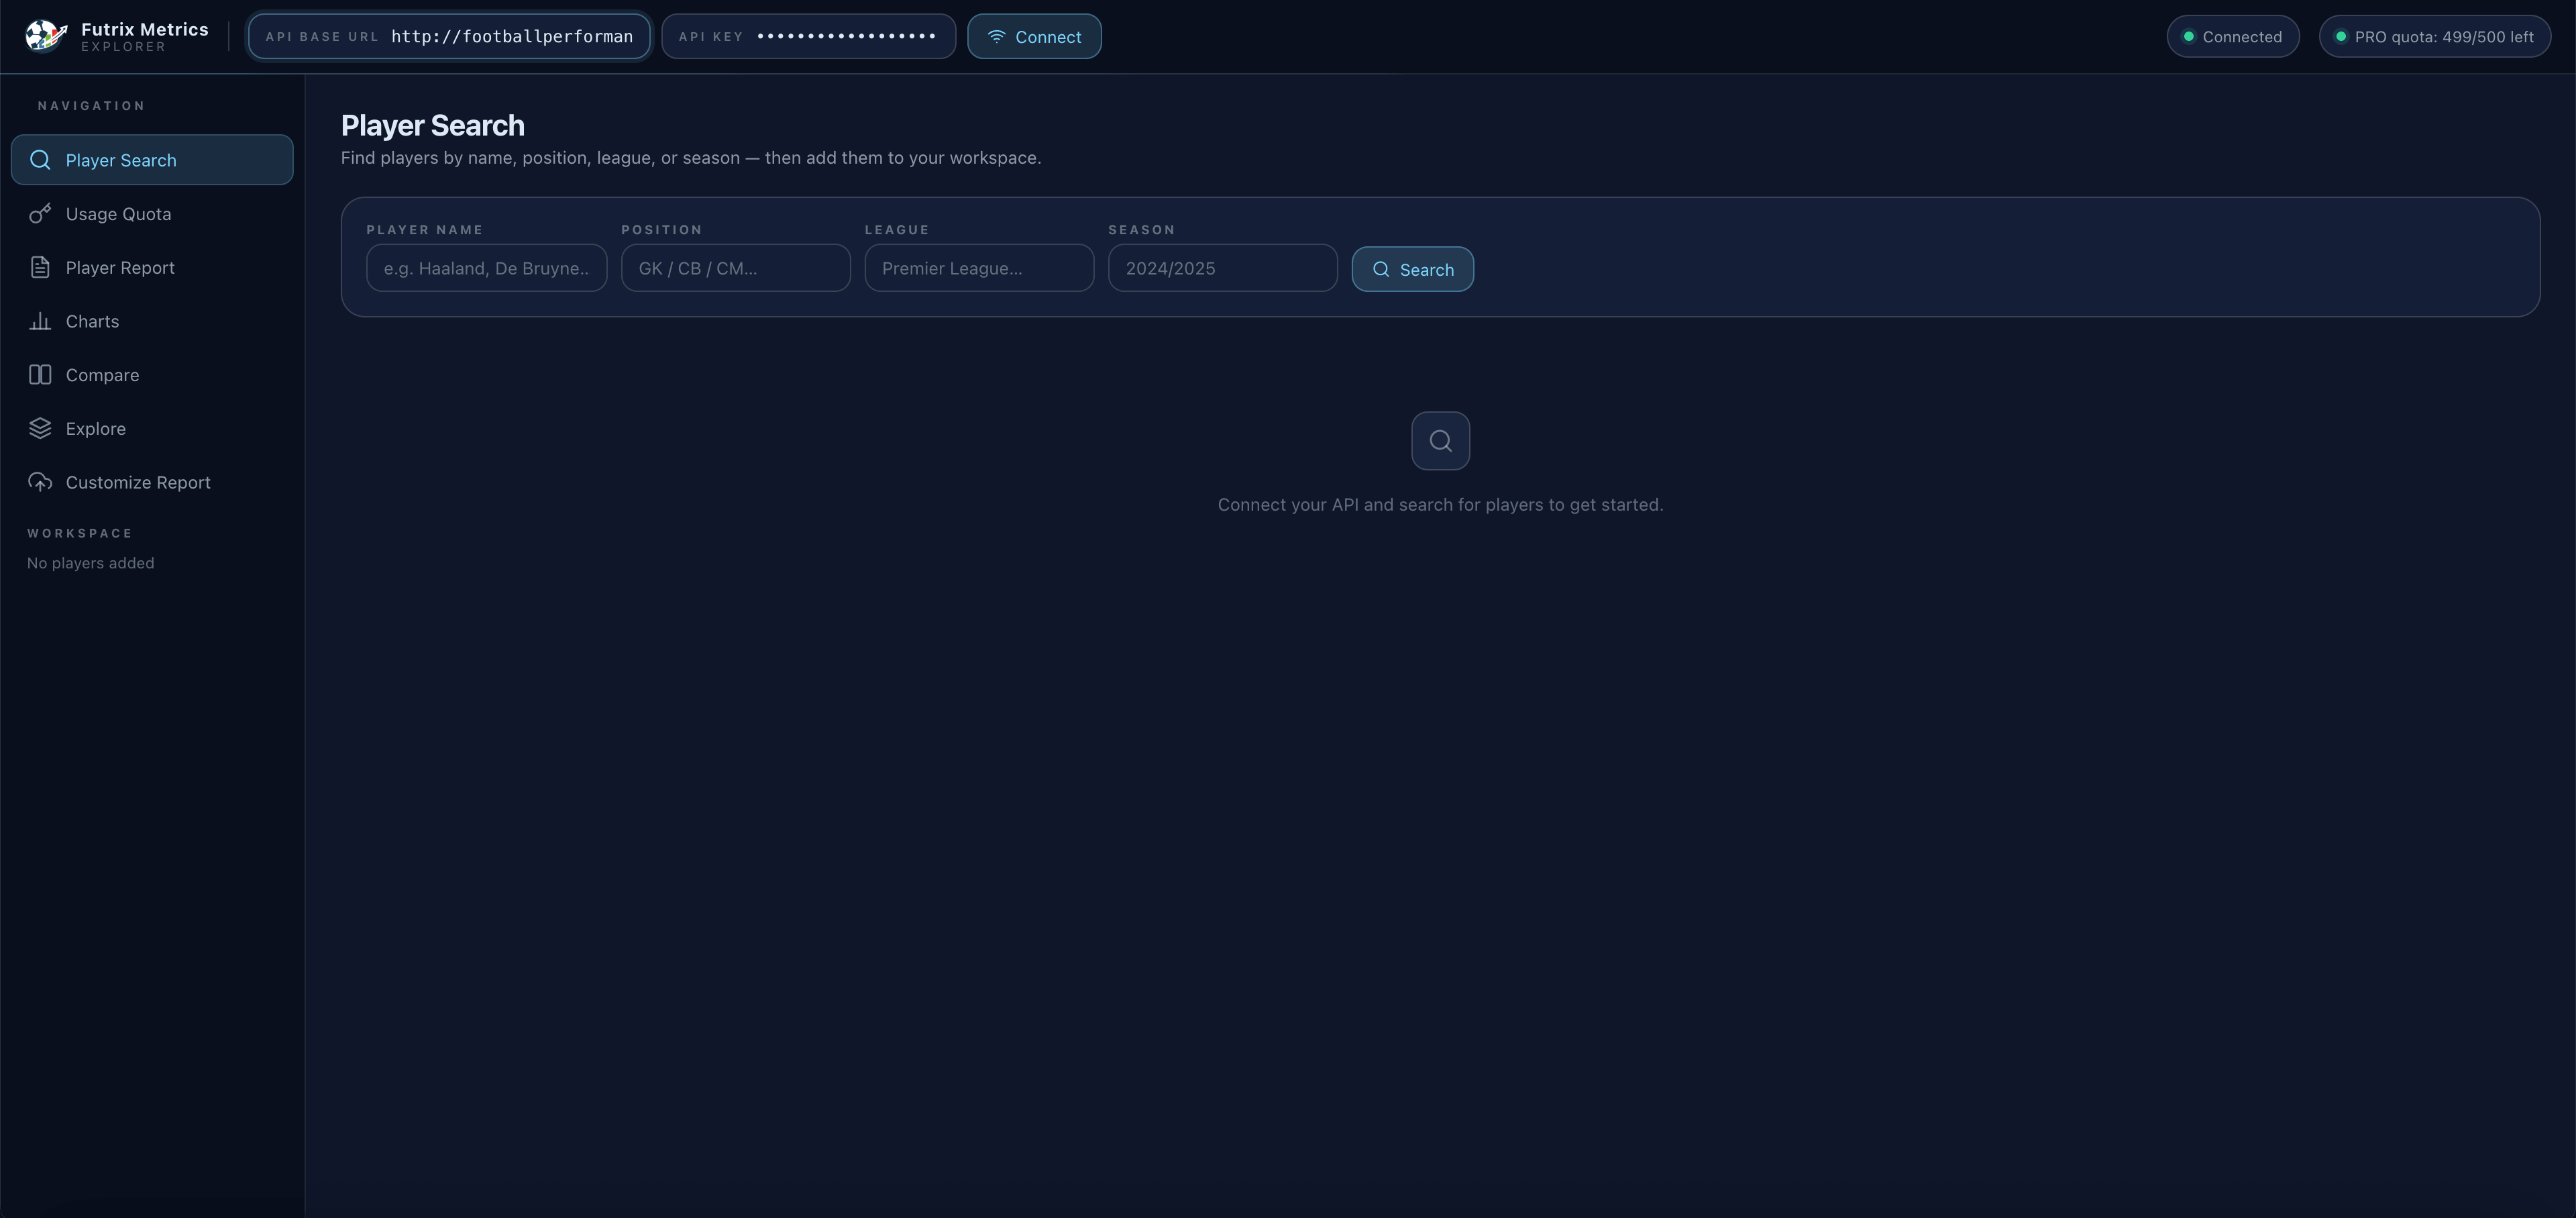
The Player Search module lets you find any player across major leagues by name, position, league, or season — no technical IDs required.
Football knowledge is richer when it’s backed by data. The Explorer gives every fan that upgrade.
Fantasy Football Managers Chasing the Edge
Fantasy leagues live and die on marginal decisions. Is that differential midfielder actually delivering in the metrics that matter — key passes, shots, progressive carries — or are their points driven by set-piece luck and clean sheets? Is the striker you’re considering worth the premium price, or do the per-90 numbers tell a less flattering story?
The Explorer’s no-code football stats tools were built for exactly these decisions. You can load any player, access their full score breakdown across seven dimensions, and then use the Feature Lab to select the specific metrics most relevant to your fantasy setup. Passes completed per 90. Shots on target. Cards per match. Goals per 90. Percentile rankings across the league.
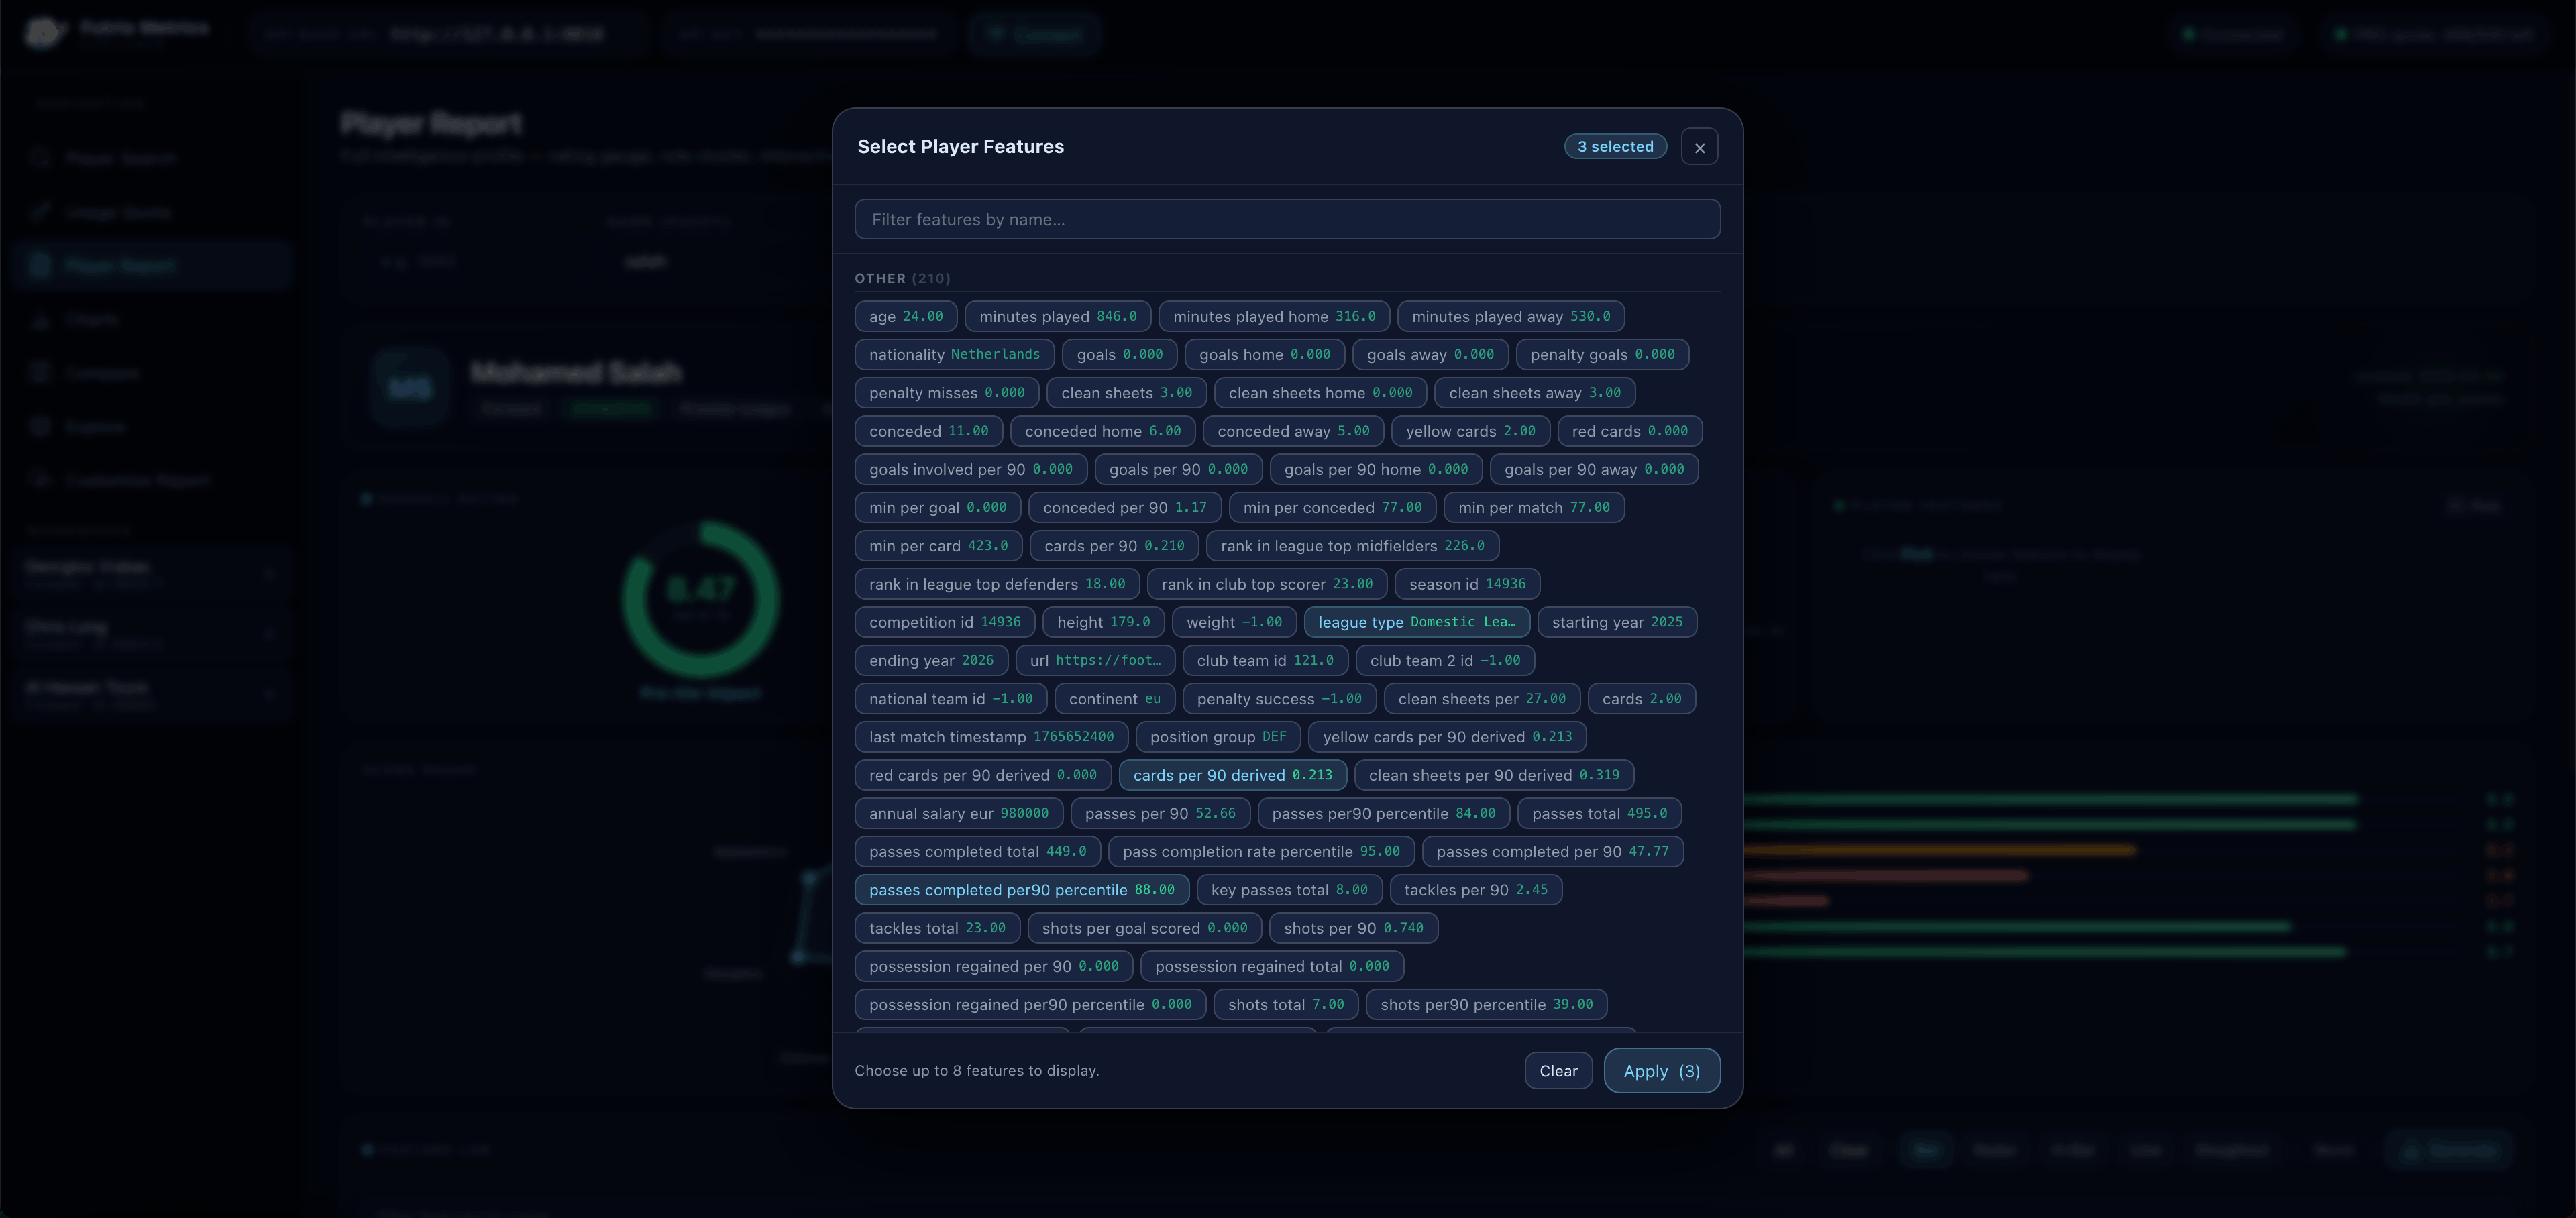
The Feature Lab lets you select up to 8 specific metrics to display — from standard stats to advanced derived figures like passes completed per 90 percentile or cards per 90 derived.
This is the kind of granular, customizable data access that fantasy analysts pay premium prices for in specialist tools. With the Futrix Explorer, it’s part of your dashboard from day one.
Journalists, Content Creators & Football Bloggers
Writing about football without data is writing with one hand tied behind your back. Your readers are sophisticated. They follow the analytics conversation. They know what xG means and they expect you to back up your takes with numbers.
The Futrix Metrics Explorer is the football data visualization tool that makes data-driven storytelling fast and accessible. Every chart you generate in the platform — radar profiles, league heatmaps, cluster distributions, score timelines — is ready to drop straight into an article or social post.
Load a player, generate their radar chart, export it, and you have a professional-quality visual that tells your readers something meaningful in one glance. Pull up a League Scores heatmap and suddenly you have a compelling visual comparison of performance standards across competitions. Build a cluster distribution chart and you can illustrate exactly how a position group breaks down by playing style in a given league.
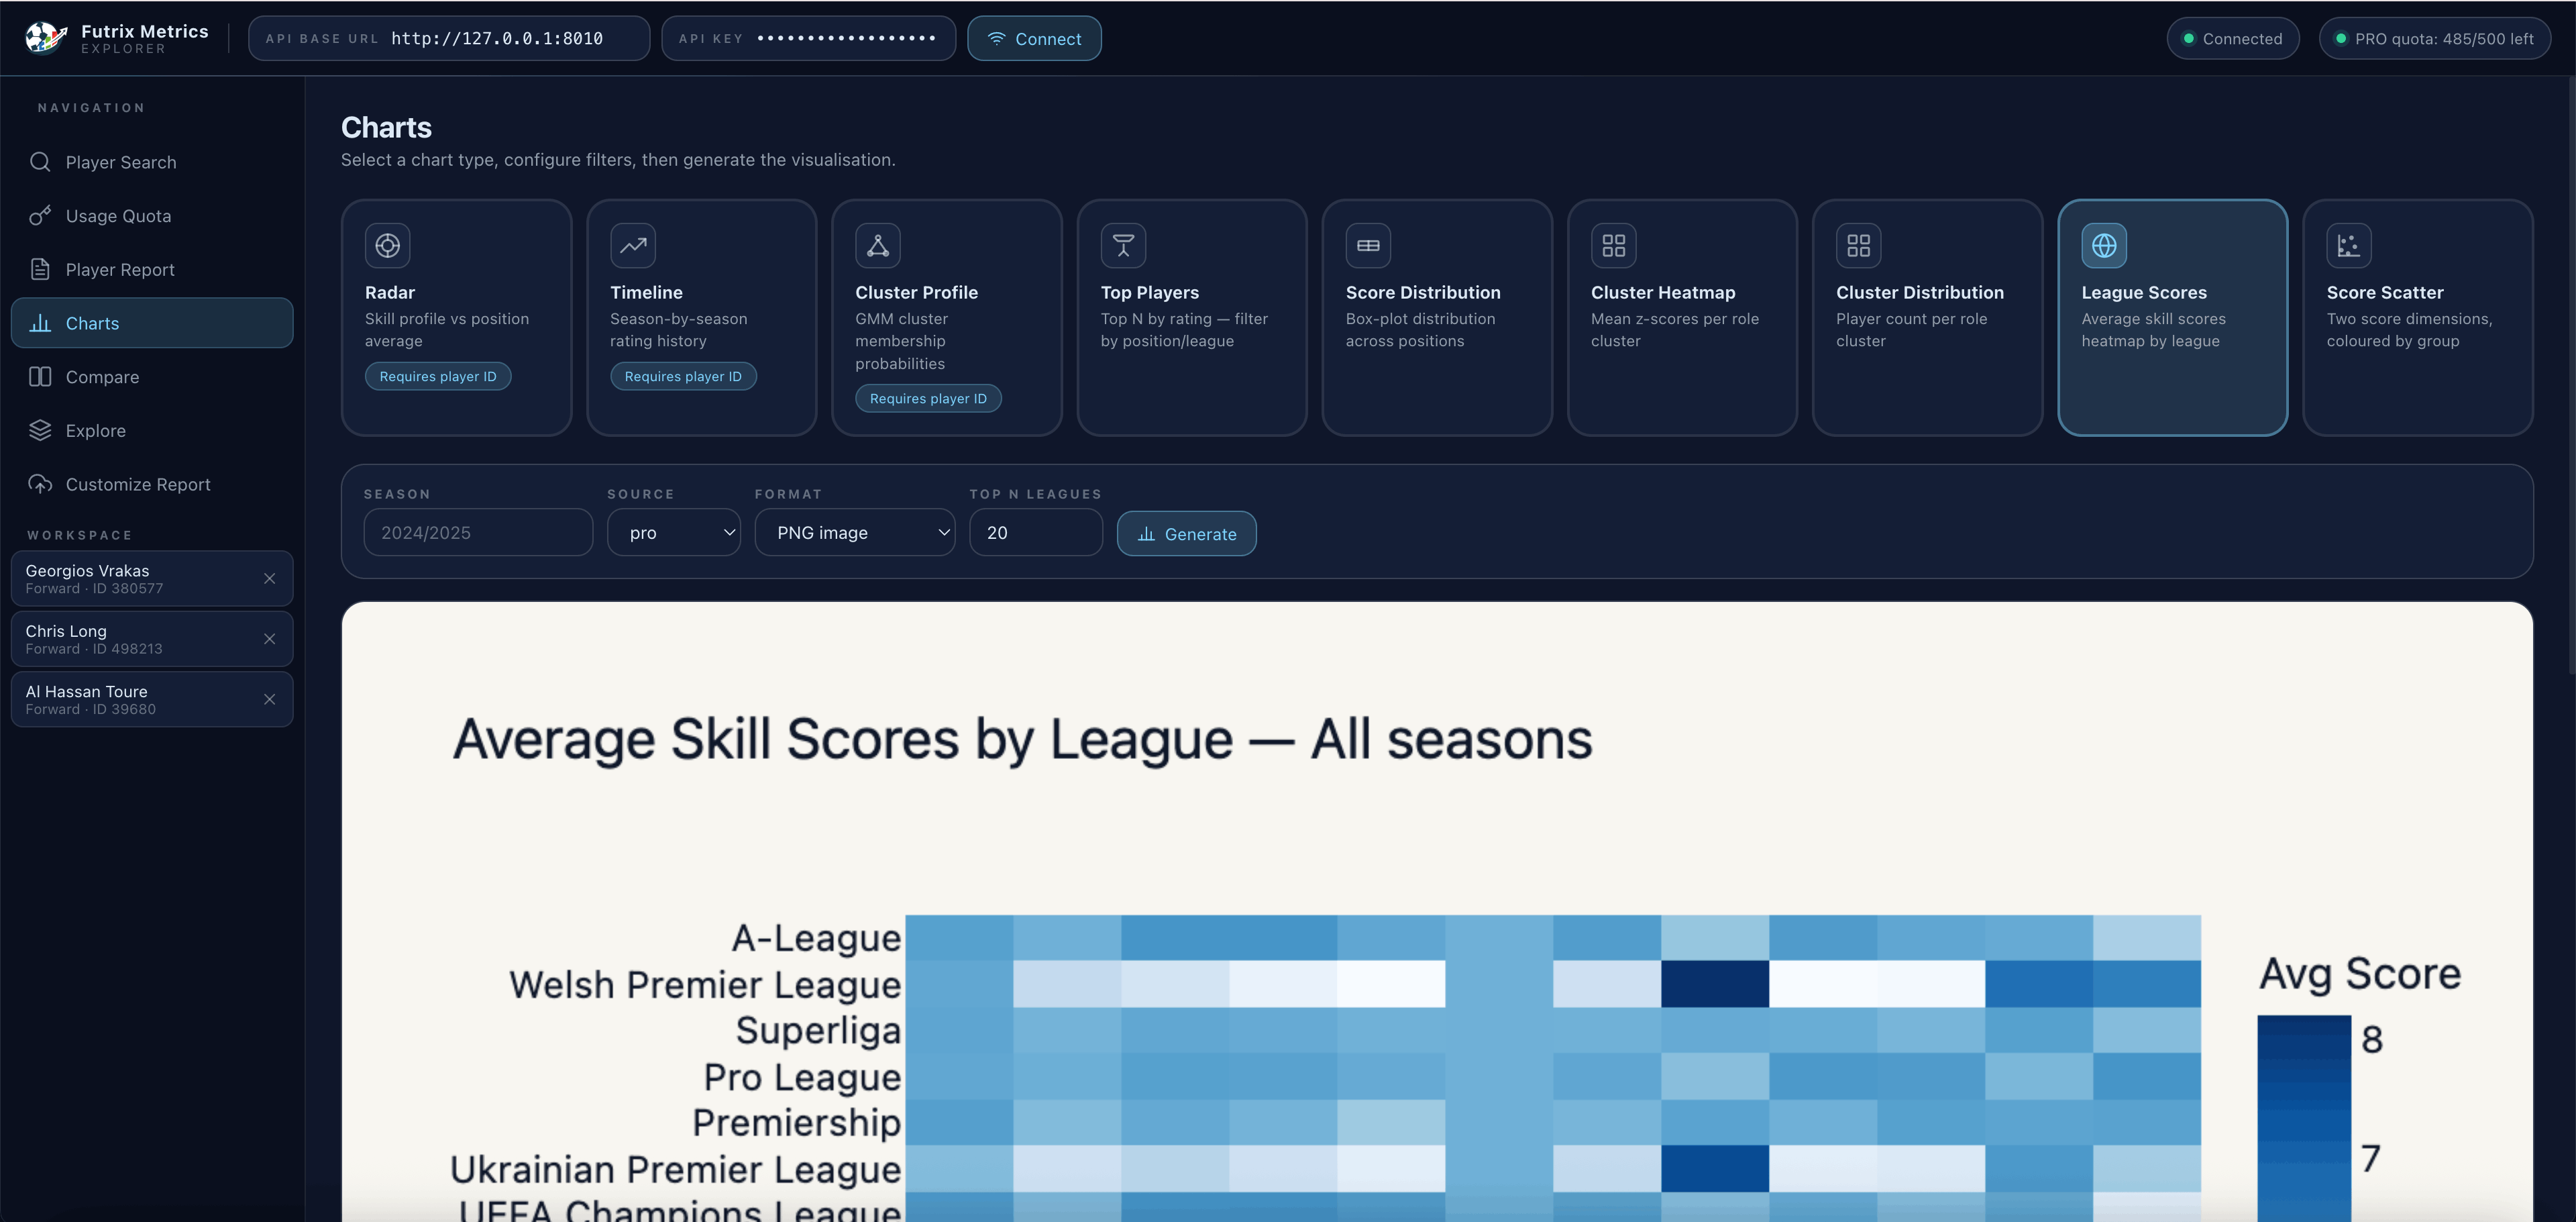
The Charts module offers nine visualization types: Radar, Timeline, Cluster Profile, Top Players, Score Distribution, Cluster Heatmap, Cluster Distribution, League Scores, and Score Scatter.
The platform doesn’t just make you more accurate — it makes your content more compelling. Readers spend longer with articles that have strong visuals. The Explorer gives you those visuals without the design overhead.
Grassroots Coaches, Local Scouts & Youth Academies
Tactical preparation used to be about watching film. Now it involves data — but most grassroots setups don’t have the budget or the technical team to access professional analytics platforms.
The Futrix Explorer changes that equation. It’s a player rating tool and scouting aid that works for anyone, from a youth academy director evaluating potential recruits to a semi-professional manager preparing for a cup match against unfamiliar opposition.
The role cluster system is particularly valuable for coaches. Rather than just showing you raw numbers, the platform classifies each player into a tactical archetype based on their scoring patterns — identifying whether a forward plays as a Poacher, a Creative Attacker, or a Wide Threat; whether a midfielder is a Box-to-Box, a Destroyer, or a Playmaker. That kind of role intelligence helps you understand not just how good a player is, but what kind of player they are and whether they fit your system.
For player recruitment at any level, that context is invaluable — and with the Futrix Explorer, it’s available to every coach without a single line of code.
Inside the Platform: Feature-by-Feature Breakdown
Player Search — Find Any Player in Seconds
The starting point for everything in the Explorer is the football dashboard’s Player Search. You don’t need a player ID. You don’t need to know the exact spelling. Just type a name, filter by position or league or season if needed, and hit Search.
Once you find the player you’re looking for, add them to your Workspace — a persistent panel on the left sidebar that lets you keep multiple players loaded and switch between their reports instantly. Your Workspace stays populated as you navigate around the platform, so you can move from a Player Report to a Comparison to the Charts module without losing your selection.
Player Report — The Complete Soccer Player Report
The Player Report is the heart of the platform and the most comprehensive soccer player report the Explorer produces. Load any player and you get their full intelligence profile:
- Overall Rating — A single score out of 10 representing the player’s composite performance level for the selected season, calculated across all dimensions of the model.
- Role Cluster — A tactical archetype classification derived from the player’s scoring profile. This tells you not just how good they are, but what kind of player they are — which is often more useful for recruitment and analysis.
- Score Radar — A seven-axis radar chart visualizing Attack, Creation, Passing, Progression, Defense, Discipline, and Appearance scores. At a glance, you can read a player’s complete profile shape — are they a complete forward, a one-trick specialist, or a defensive liability?
- Score Breakdown — A horizontal bar chart showing the exact score for each dimension, colour-coded for quick reading. You can see at a glance which areas are strengths (green), which are average (yellow), and which need attention (red).
- Player Features Panel — Key individual stats displayed alongside the scores, including league type, passes completed per 90 percentile, cards per 90, and other contextual metrics selected from the Feature Lab.
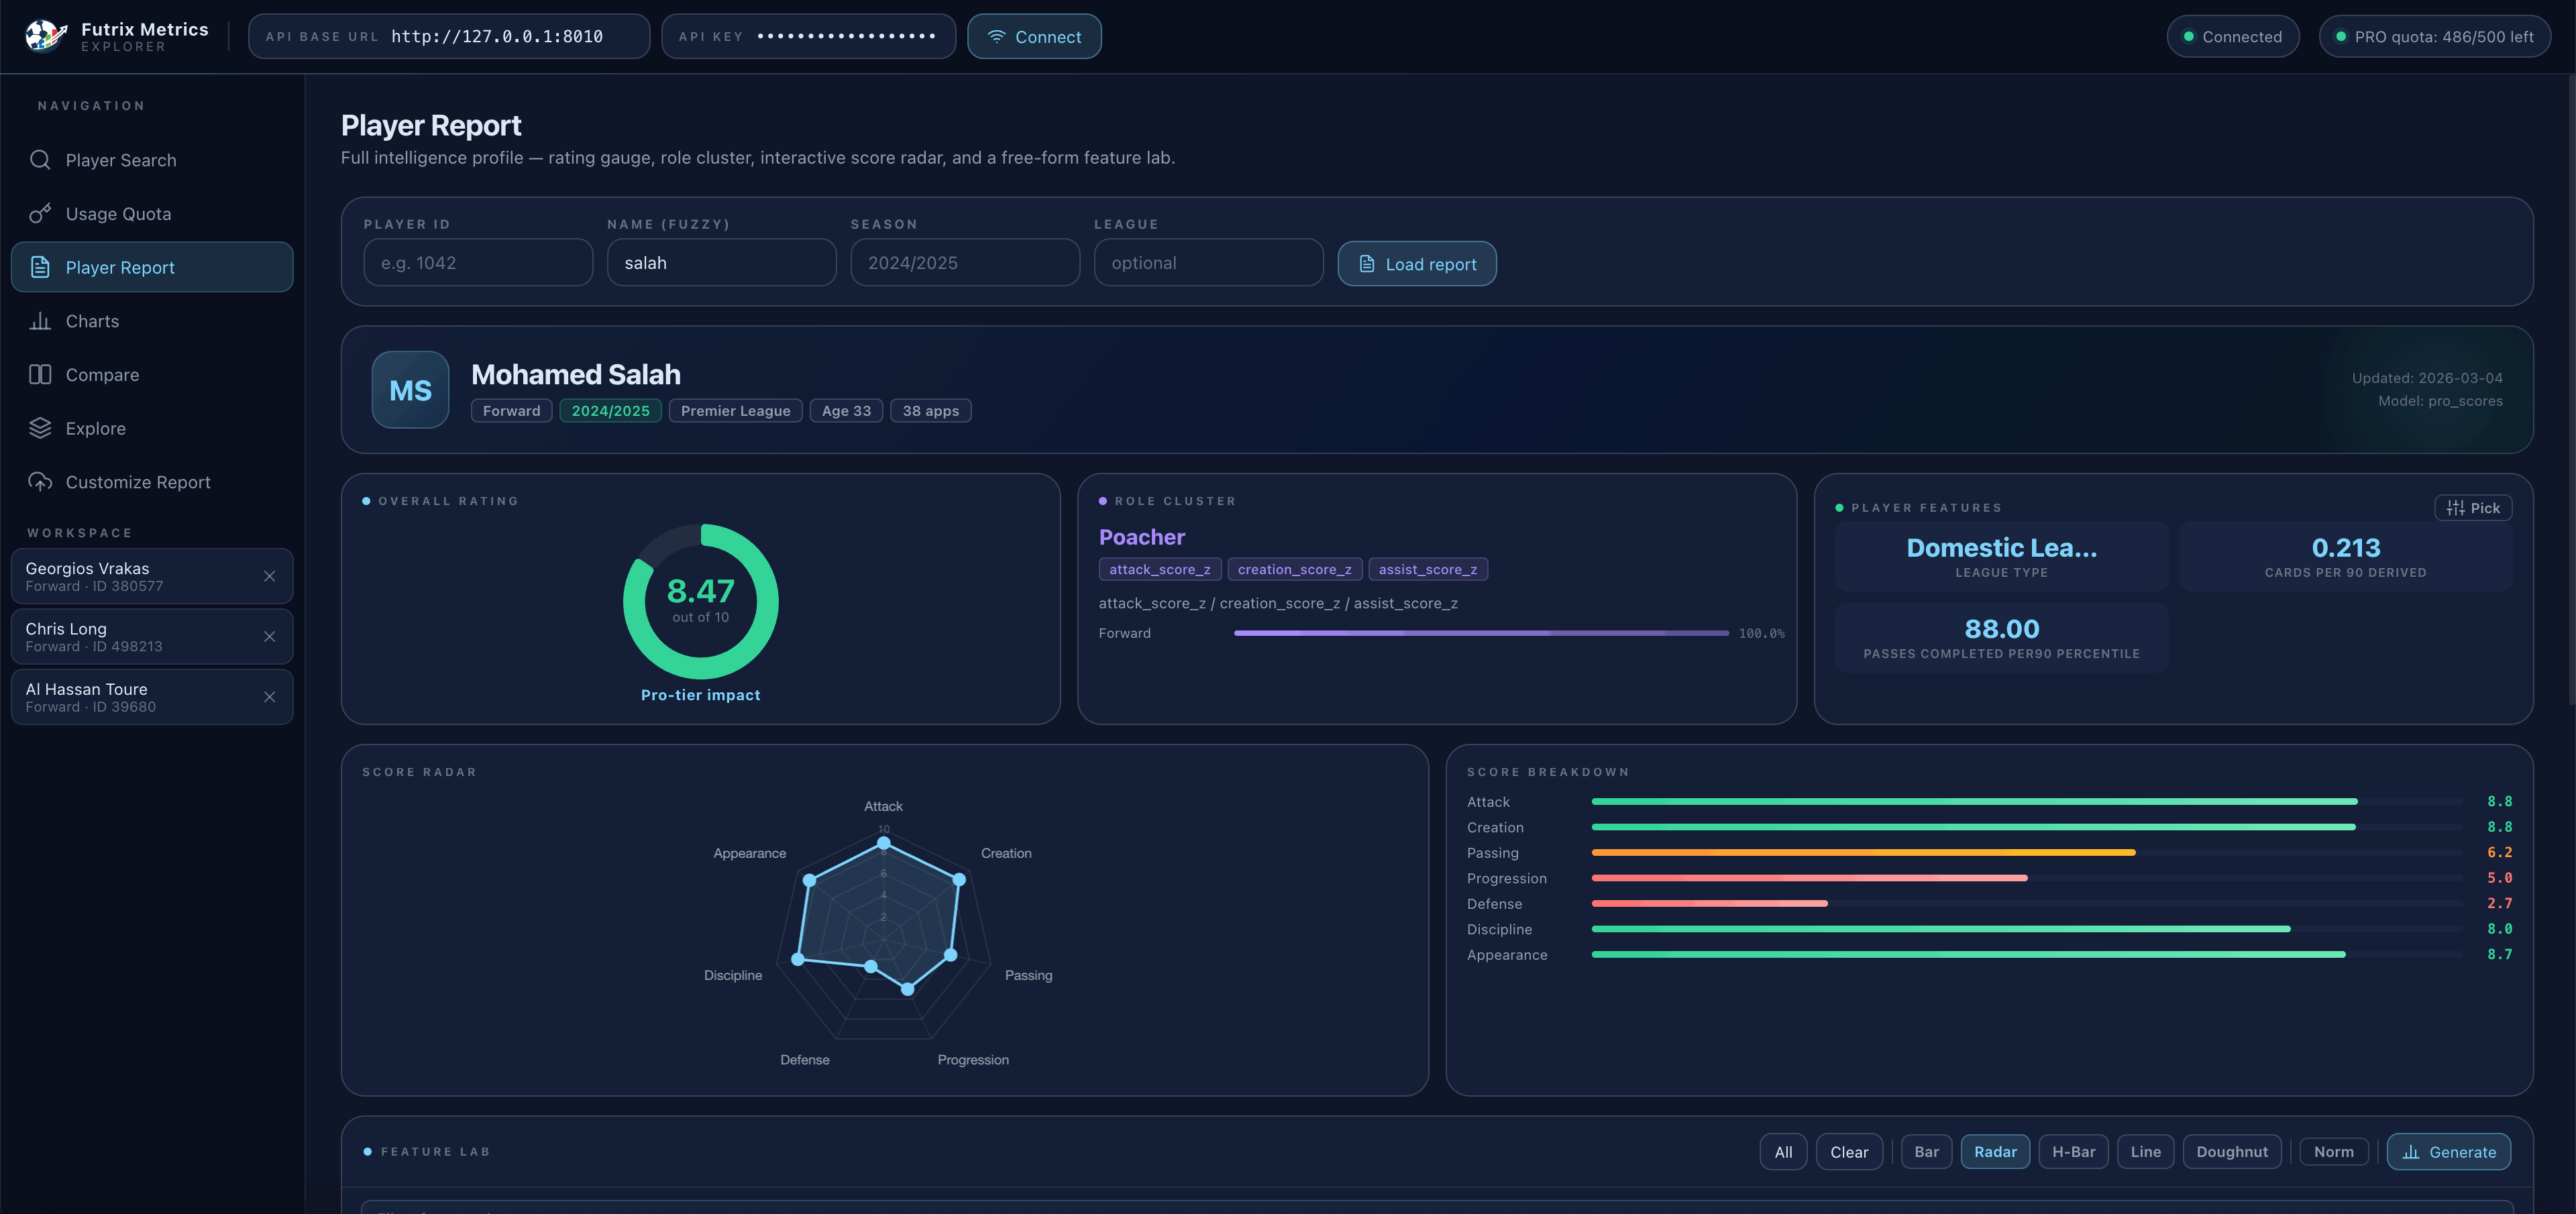
Mohamed Salah in the 2024/2025 Premier League season: 8.47/10 overall rating, classified as a “Poacher” with Pro-tier impact. Attack: 8.8, Creation: 8.8, Passing: 6.2.
This is the player rating tool at its most complete. In a single scrollable page, you have everything you need to understand a player’s performance level, tactical role, and statistical profile — with no raw data to decode yourself. Try the rating and cluster demo →
Feature Lab — Customize Your Stats View
Not every user needs the same metrics. A fantasy manager cares about different numbers than a tactical analyst. The Feature Lab solves this by letting you select up to 8 specific data points to display alongside the standard report.
The feature library contains hundreds of metrics across multiple categories — basic counting stats (goals, assists, appearances), derived per-90 figures (shots per 90, key passes per 90), percentile rankings (passes completed per 90 percentile), positional context, disciplinary records, and more. You filter by name, select the ones you want, and the report rebuilds itself around your choices.
This turns the Player Report into a fully customizable no-code football stats workspace. You define what matters. The platform delivers it.
Player Comparison Tool — Head-to-Head on Every Dimension
The player comparison tool is one of the most-used features in the Explorer, and it’s easy to see why. Transfer windows, fantasy decisions, positional debates — almost every football conversation comes down to comparing two or three players. The Comparison module makes that instant.
Add up to three players to your Workspace, navigate to Compare, and the platform overlays their radar profiles on a single chart. You can see immediately where one player dominates — and where they fall short. The visual difference is far more informative than a table of raw numbers, because the shape of the radar tells a story about the player’s overall profile.
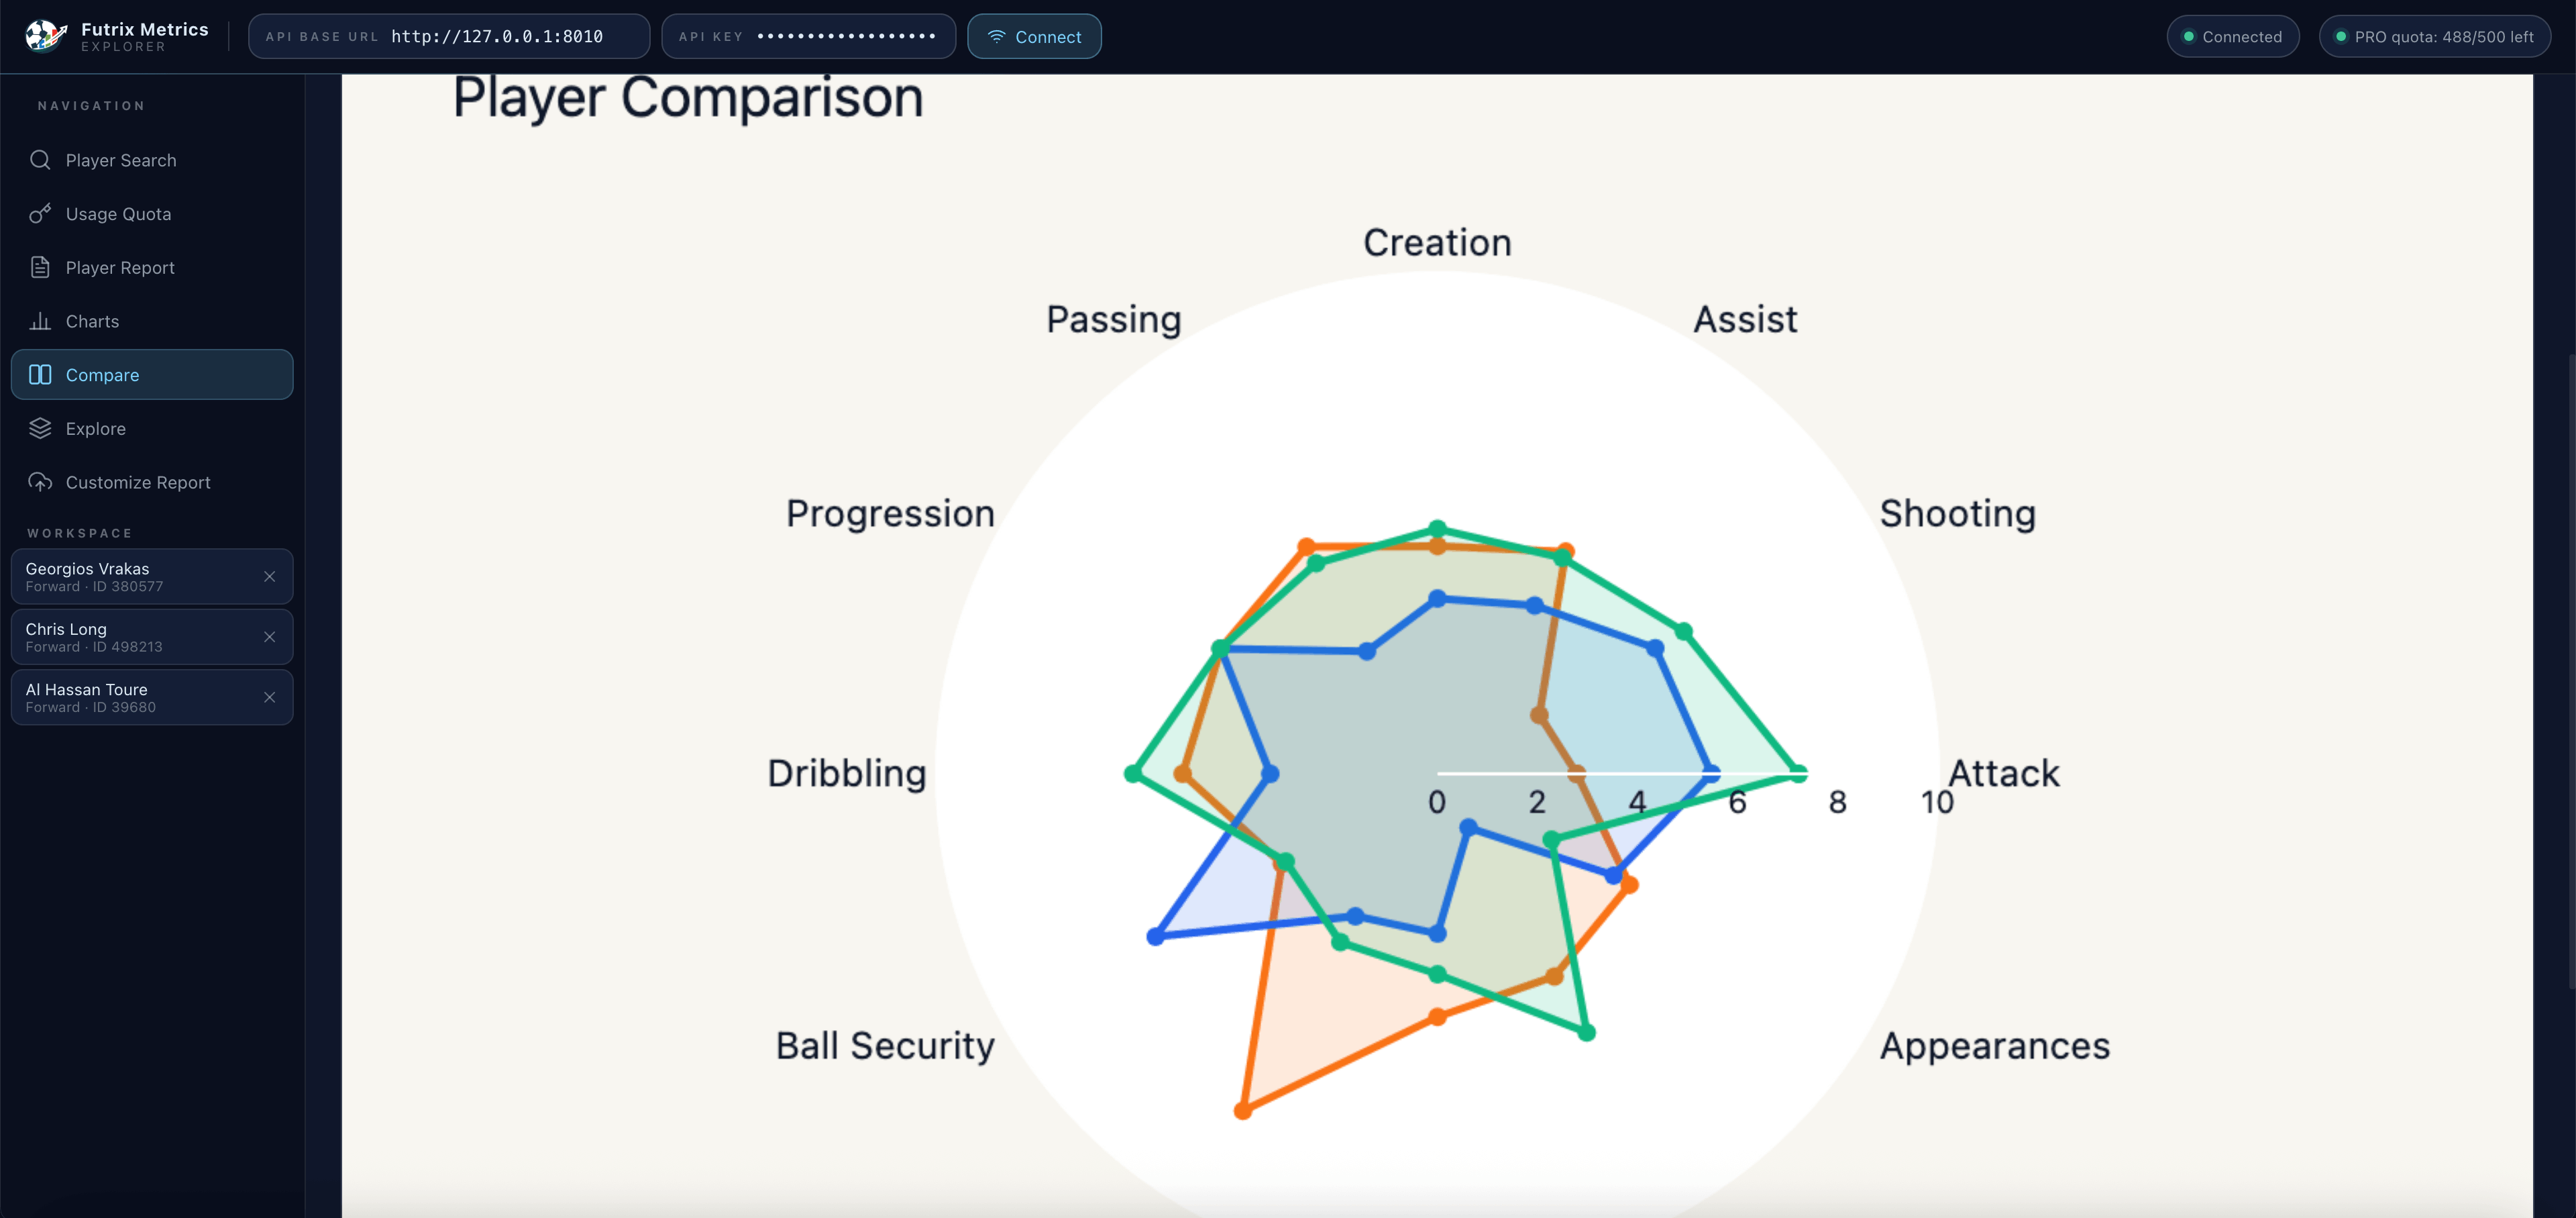
Compare multiple players simultaneously — passing, creation, attacking output, progression, defense, discipline — all on one radar chart.
The Comparison view is filterable by season, so you can compare players in the same campaign for a like-for-like reading, or track how a single player’s profile has evolved year over year. For journalists writing transfer analysis, or fans making the case for (or against) a signing, this football data visualization feature is immediately compelling.
Charts — League-Wide Football Data Visualization
The Charts module steps back from individual players and gives you a bird’s-eye view of the data across entire leagues and competitions. It’s where the platform’s football data visualization capabilities go deepest.
Nine chart types are available, each suited to a different kind of analysis:
- Radar — A spider chart of a player’s score profile. Best for individual profiling.
- Timeline — Season-by-season rating history. Track improvement or decline over multiple campaigns.
- Cluster Profile — UGM cluster membership probabilities. See how cleanly a player fits their role classification.
- Top Players — Filter by rating or position to surface the best performers in a league. Perfect for discovering hidden gems.
- Score Distribution — Box-plot distributions showing how scores are spread across positions in a league. Understand context.
- Cluster Heatmap — Mean scores per role cluster. Compare how different tactical archetypes perform on average.
- Cluster Distribution — Player count per role cluster. See how many players populate each tactical type in a given league.
- League Scores — Average skill scores across leagues, visualized as a heatmap. Instantly see which competitions produce the strongest performers in each dimension.
- Score Scatter — Two-dimension scatter plots with players as points, coloured by group. Identify outliers and clusters visually.
The League Scores heatmap shows how average player performance compares across leagues worldwide — a compelling football data visualization for any tactical or journalistic analysis.
For content creators, the Charts module is a publication-ready visual generator. For coaches and scouts, it’s a context-setting tool that shows where a target league sits in the global performance landscape.
Customize Report — AI-Powered Scout Intelligence
The Customize Report section is the most advanced feature in the platform, and the one that most clearly shows where soccer analytics for fans is heading.
Beyond the standard radar and score breakdown, the Customize Report generates an AI Scout Intelligence Brief — a written, plain-English summary of a player’s tactical profile, strengths, weaknesses, and role suitability. This isn’t generic text. It’s generated from the player’s actual scoring data and cluster classification, making it specific, actionable, and accurate.
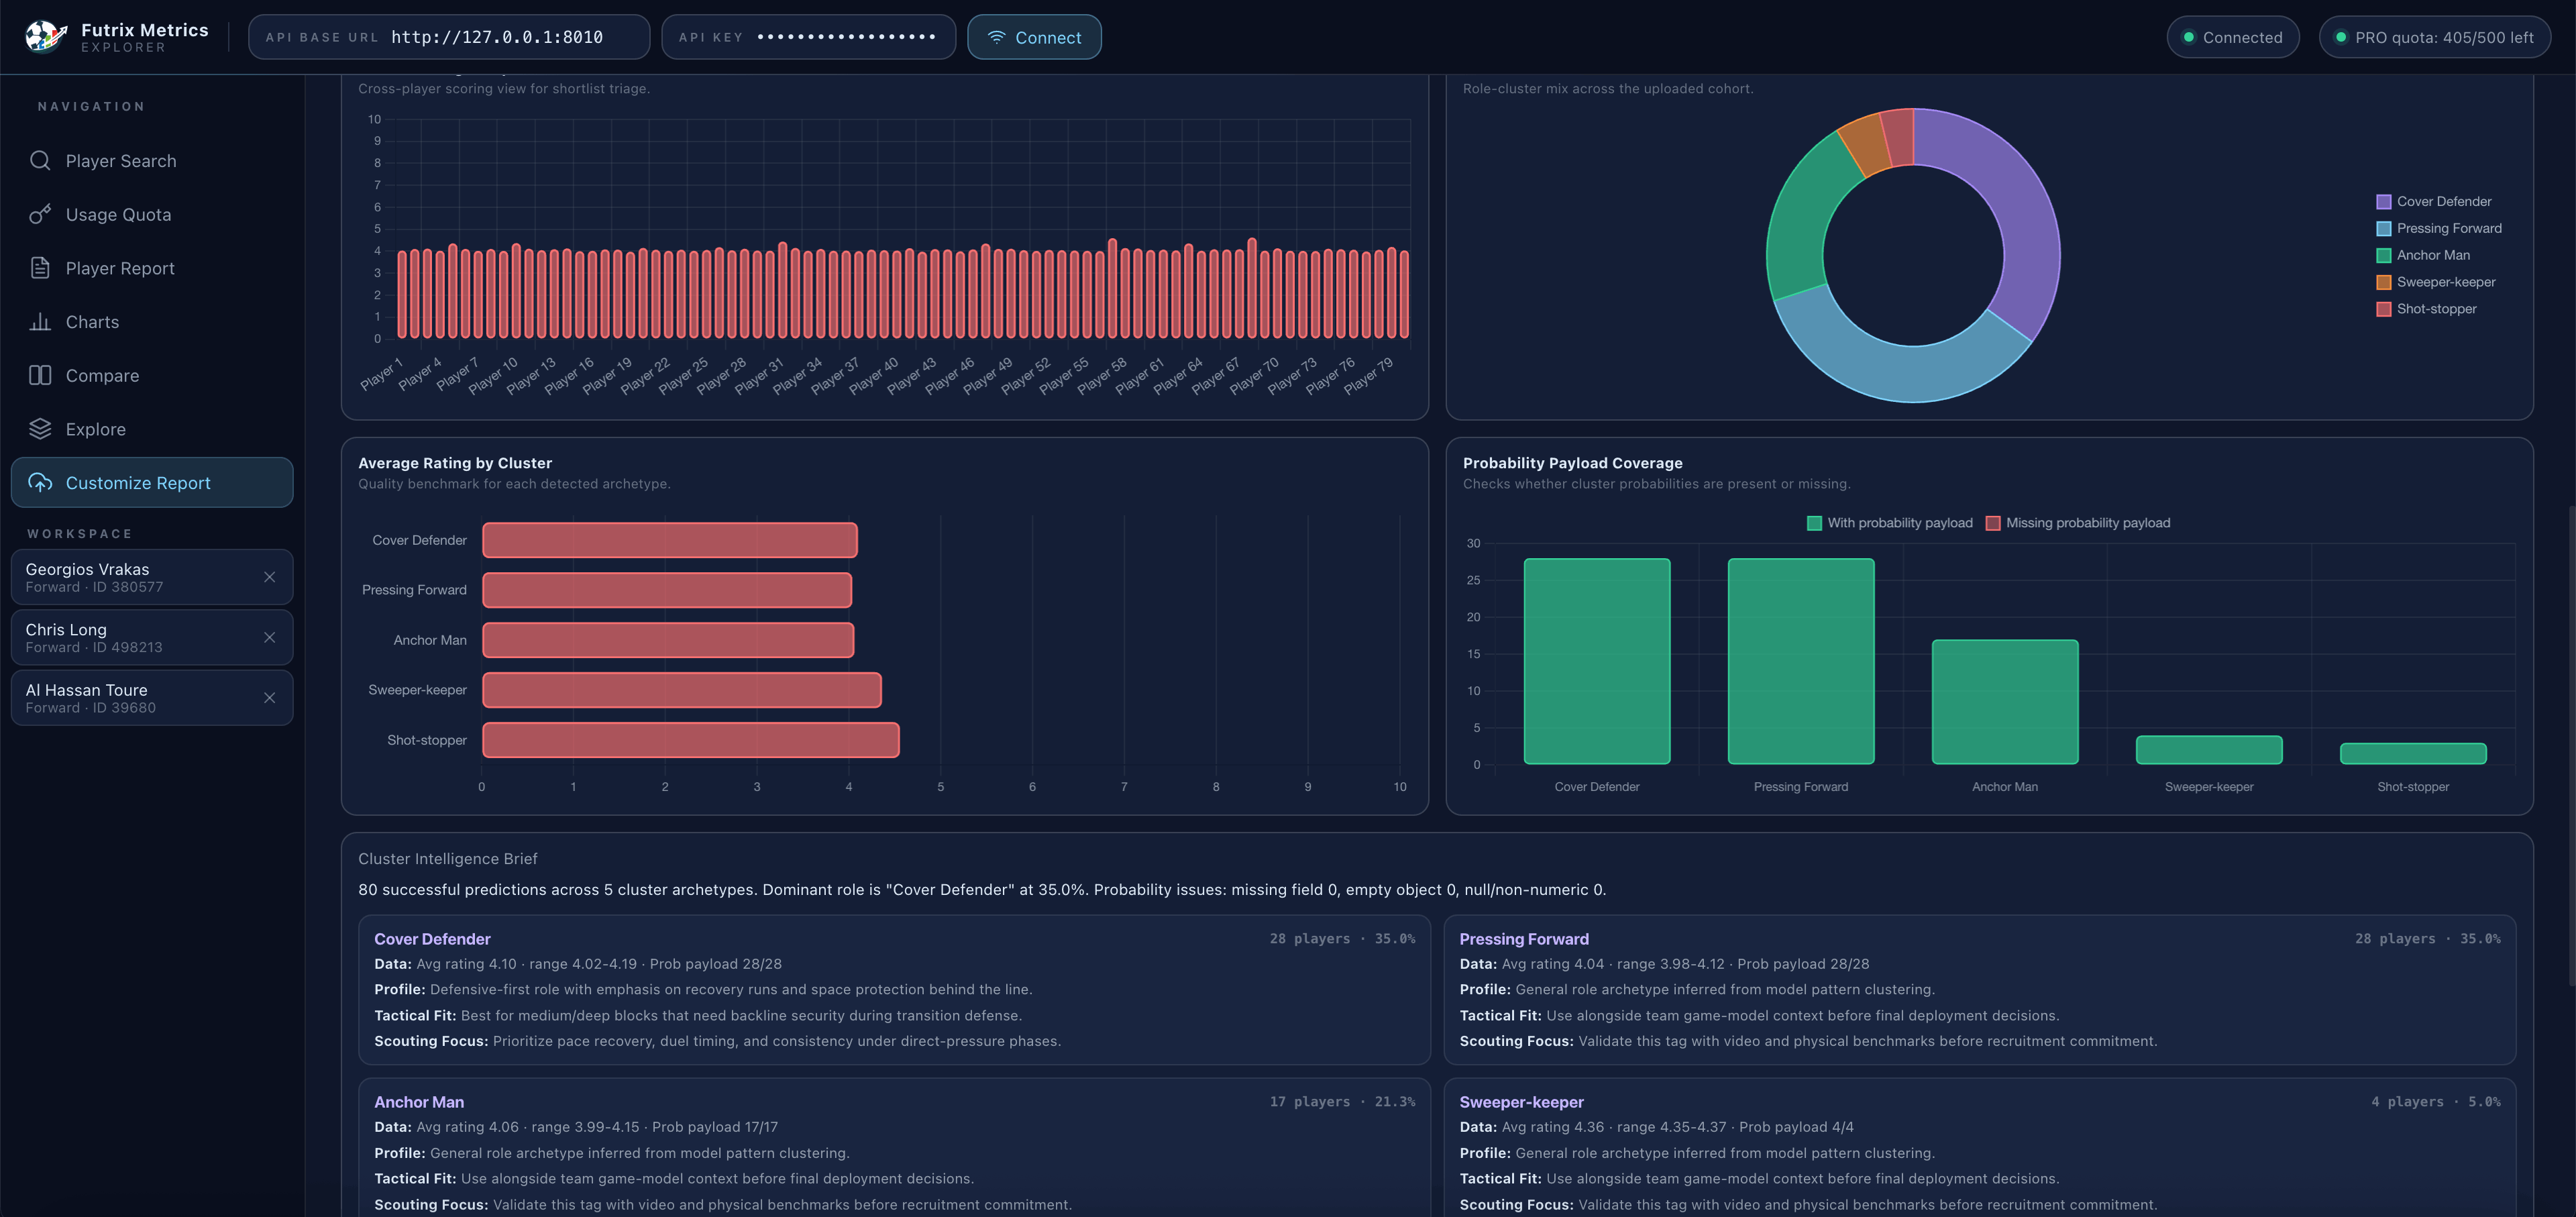
The Scout Intelligence Brief generates a written analytical summary alongside cluster probability charts — giving you both a visual and a narrative understanding of any player.
Alongside the written brief, the Customize Report displays probability payload coverage charts that show how confidently the model assigns a player to their role cluster, and cluster-level average ratings that contextualize the player’s scores within their peer group. You’re not just seeing the number — you’re seeing what the number means.
For journalists, this brief is a starting point for player profile pieces that would otherwise require hours of research. For scouts, it’s a first-pass evaluation tool that surfaces the right questions before a more detailed live assessment. For fans, it’s the answer to “but what does the data actually say about them?” in plain language.
Getting Started: From Zero to Your First Player Report in Under 2 Minutes
There is no lengthy onboarding. There is no trial form to fill in or approval to wait for. Getting into the Futrix Metrics Explorer is the simplest possible path from intent to action.
Step 1 — Choose your plan. Head to the Services page to pick a plan — including a free Basic tier to get started. The process takes under a minute.
Step 2 — Get your API key. Once signed up, log in to your account and copy your API key from the dashboard. This is a single string of characters — your personal credential that connects you to the platform.
Step 3 — Open Futrix Metrics Explorer. Launch the Explorer in your browser. You’ll see the connection bar at the top with two fields: API Base URL and API Key.
Step 4 — Connect. Paste your API key into the field, hit the Connect button, and watch the status indicator turn green. You are now connected to the full football intelligence database.
Step 5 — Search for a player. Type any player name into the Player Search. Hit Search. Add them to your Workspace.
Step 6 — Load their report. Navigate to Player Report, enter their name, select the season, and hit Load Report.
That’s the complete process. In under two minutes from account creation, you have a full soccer player report on screen — rating, radar, role cluster, score breakdown, and feature stats. No tutorials. No technical documentation to wade through. No developer needed.
How to Access the Platform
Step 1 — Register and Subscribe
To use Futrix Metrics Explorer, you need an active API subscription. Head to the Services page and sign up for an account.
For full platform access, choose a Plus, Pro, or Scale plan:
| Plan | API Access | Best For |
|---|---|---|
| Plus | 500 platform sessions / month | Individual analysts, journalists, fantasy managers |
| Pro | 1,500 platform sessions / month | Coaches, scouts, and repeat analysis workflows |
| Scale | Unlimited platform sessions | Agencies, academies, high-volume users |
Both plans unlock the complete Explorer feature set — Player Reports, Feature Lab, Comparison Tool, Charts, and AI Scout Intelligence Briefs. The free Basic tier provides limited access to explore the platform before committing.
Step 2 — Generate Your API Key
Once subscribed, log in to your Futrix Metrics dashboard and navigate to the API key section. Click Generate API Key — this creates your personal credential that authenticates every request you make through the platform.
Keep your API key private. It is tied to your account quota and subscription tier.
Step 3 — Open the Explorer and Connect
Launch the platform directly in your browser:
https://footballperformanceapi.site/report/customize?api_key=YOUR_API_KEYReplace YOUR_API_KEY with the key you generated in the dashboard. The platform will authenticate instantly and connect you to the full football intelligence database — no setup, no configuration, no code.
Once connected, you have immediate access to every feature: player search, performance reports, role clusters, comparison charts, and AI-generated scout briefs. Your platform quota usage is visible in the top-right corner at all times so you always know where you stand.
Real-World Use Cases: How Different Users Actually Use the Explorer
The Transfer Window Analyst
Every summer and January, millions of fans debate whether their club is making smart signings. With the Futrix Explorer, that debate can be grounded in data. Load the rumoured target, pull their Player Report, compare their radar against the player being replaced, and check their role cluster. Is the new arrival actually a like-for-like replacement, or are they a fundamentally different type of player? The data tells you.
The Match Preview Writer
You write preview content for a football blog or social media channel. Every match, you need to explain why this game matters and which players to watch. The Explorer lets you pull reports on the key players from both sides, export radar charts for visual content, and back up your picks with specific score data. Your previews become more authoritative and more shareable.
The Academy Director
You’re evaluating teenage players across three different academies for potential recruitment. You have video, you have your own observations — but you also want data context. Where do these players rank in their age group across the league? What does their scoring pattern suggest about their long-term role? The Explorer gives you that context quickly, without requiring a data team.
The Fantasy League Obsessive
It’s Thursday night. You have two transfer options for your fantasy team and you need to make a call. One player has better recent form but the other has better underlying numbers — passes completed, shots on target, progressive carries. You load both into the Explorer, run the comparison, select the specific metrics that drive fantasy points in your league’s scoring system, and make the call with confidence rather than gut feel.
Frequently Asked Questions
Do I need any coding knowledge to use Futrix Metrics Explorer? None at all. The Explorer is a fully no-code platform. You connect with your API key through a browser interface and navigate everything through point-and-click menus. No terminal, no programming, no scripts.
Is it the same data as the API? Yes. The Explorer accesses the same underlying Futrix Metrics football intelligence database that the API serves. You’re not getting a simplified or reduced dataset — you’re getting the same depth of player statistics, scores, and role cluster data, presented visually instead of as raw JSON.
What leagues and seasons are covered? Futrix Metrics covers all major domestic leagues and competitions across multiple seasons. The Player Search lets you filter by league and season to find exactly the data you need. League coverage is continually expanding.
How does the platform quota work? Your API subscription includes a platform allowance based on your plan. Plus includes 500 platform sessions per month, Pro includes 1,500, and Scale is unlimited. Your current quota usage is visible in the top-right corner of the football dashboard at all times, so you always know where you stand. View all quota limits on the Services page.
Can I use the Explorer and the API together? Absolutely. Many users start with the Explorer to explore data visually, then use the API to pull specific data points programmatically once they know exactly what they’re looking for. The same API key works for both.
Is the Explorer suitable for professional scouting? The Explorer is a powerful first-look tool for professional scouts and coaches. The role cluster classification, score radars, and AI Scout Intelligence Briefs provide meaningful player intelligence quickly. For heavy-volume scouting workflows requiring bulk data access or custom integrations, the raw API is more appropriate — but the two tools work well together as part of a broader analytics workflow.
Why Futrix Metrics Explorer Matters Right Now
Football analytics has reached an inflection point.
Five years ago, data-driven analysis was the preserve of Premier League clubs and the handful of boutique analytics firms they could afford to hire. Today, the data infrastructure exists to make that same quality of analysis available to anyone — but most of the tools that access it still require technical expertise to operate.
That gap is the problem Futrix Metrics Explorer solves. It’s a football analytics platform with the depth of a professional tool and the accessibility of a consumer app. It serves the fan who wants to understand football more deeply, the journalist who wants to back up their reporting with real numbers, the coach who wants data-driven context without a data science budget, and the fantasy manager who wants every possible edge.
The shift toward soccer analytics for fans isn’t a trend — it’s the direction football intelligence is inevitably heading. The question isn’t whether data will become central to how ordinary fans understand the game. It already has. The question is whether you have the right tools to access it.
Futrix Metrics Explorer is that tool. It’s a player rating tool, a player comparison tool, a football data visualization suite, and a fully interactive football dashboard — all in one browser tab, all accessible with a single API key.
The data is already there. Now you can actually see it.
Get your API key and start your first player report →
Futrix Metrics Explorer is available to all Futrix API subscribers. Pro quota is included with your subscription. Coverage spans major global leagues across multiple seasons. View available plans or contact us for enterprise enquiries.